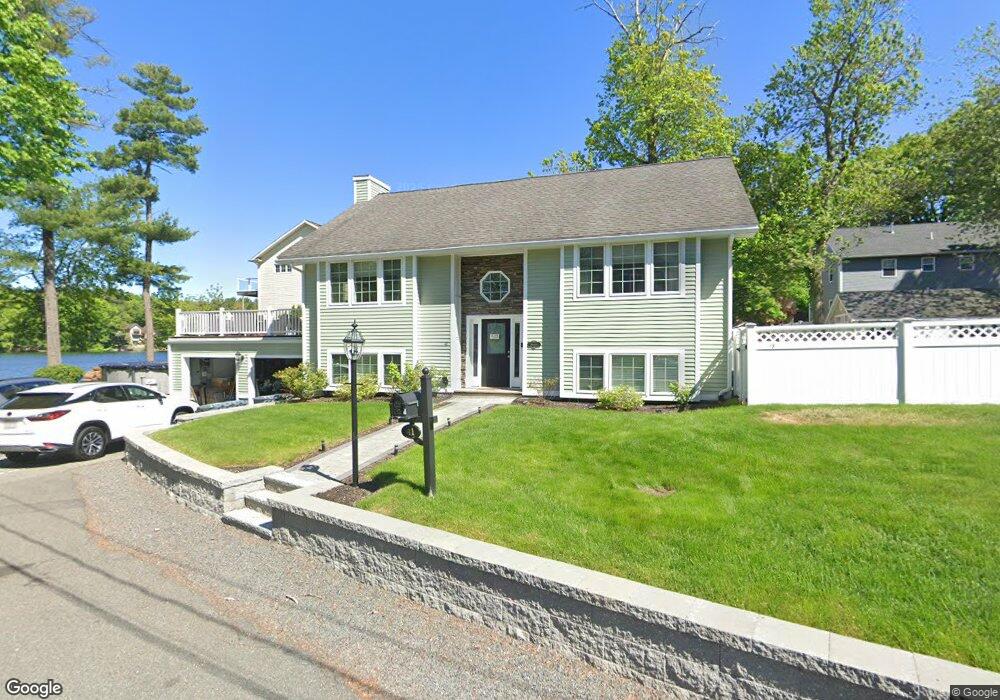
41 Island Rd Lynnfield, MA 01940
Estimated Value: $1,144,000 - $1,255,000
3
Beds
3
Baths
2,339
Sq Ft
$504/Sq Ft
Est. Value
About This Home
This home is located at 41 Island Rd, Lynnfield, MA 01940 and is currently estimated at $1,178,740, approximately $503 per square foot. 41 Island Rd is a home located in Essex County with nearby schools including Lynnfield Middle School, Pickering Middle School, and Lynnfield High School.
Ownership History
Date
Name
Owned For
Owner Type
Purchase Details
Closed on
Nov 7, 2006
Sold by
Deluties Derrick K and Deluties Michelle A
Bought by
Deluties Derrick K
Current Estimated Value
Home Financials for this Owner
Home Financials are based on the most recent Mortgage that was taken out on this home.
Original Mortgage
$565,200
Interest Rate
6.71%
Mortgage Type
Purchase Money Mortgage
Purchase Details
Closed on
Sep 14, 2006
Sold by
Johnson Donna L
Bought by
Deluties Derrick K
Home Financials for this Owner
Home Financials are based on the most recent Mortgage that was taken out on this home.
Original Mortgage
$565,200
Interest Rate
6.71%
Mortgage Type
Purchase Money Mortgage
Purchase Details
Closed on
Oct 26, 2005
Sold by
Island Rt and Waldo Laureen A
Bought by
Johnson Donna L
Create a Home Valuation Report for This Property
The Home Valuation Report is an in-depth analysis detailing your home's value as well as a comparison with similar homes in the area
Home Values in the Area
Average Home Value in this Area
Purchase History
| Date | Buyer | Sale Price | Title Company |
|---|---|---|---|
| Deluties Derrick K | -- | -- | |
| Deluties Derrick K | $706,500 | -- | |
| Johnson Donna L | $150,000 | -- |
Source: Public Records
Mortgage History
| Date | Status | Borrower | Loan Amount |
|---|---|---|---|
| Open | Johnson Donna L | $600,000 | |
| Previous Owner | Johnson Donna L | $565,200 | |
| Previous Owner | Johnson Donna L | $105,975 |
Source: Public Records
Tax History Compared to Growth
Tax History
| Year | Tax Paid | Tax Assessment Tax Assessment Total Assessment is a certain percentage of the fair market value that is determined by local assessors to be the total taxable value of land and additions on the property. | Land | Improvement |
|---|---|---|---|---|
| 2025 | $10,920 | $1,034,100 | $601,700 | $432,400 |
| 2024 | $9,648 | $918,000 | $532,500 | $385,500 |
| 2023 | $9,964 | $881,800 | $505,200 | $376,600 |
| 2022 | $9,933 | $828,400 | $505,200 | $323,200 |
| 2021 | $9,747 | $734,500 | $433,800 | $300,700 |
| 2020 | $9,421 | $676,800 | $375,000 | $301,800 |
| 2019 | $9,181 | $660,000 | $358,200 | $301,800 |
| 2018 | $8,995 | $653,700 | $358,200 | $295,500 |
| 2017 | $9,008 | $653,700 | $358,200 | $295,500 |
| 2016 | $8,735 | $602,400 | $320,400 | $282,000 |
| 2015 | $8,729 | $602,400 | $320,400 | $282,000 |
Source: Public Records
Map
Nearby Homes