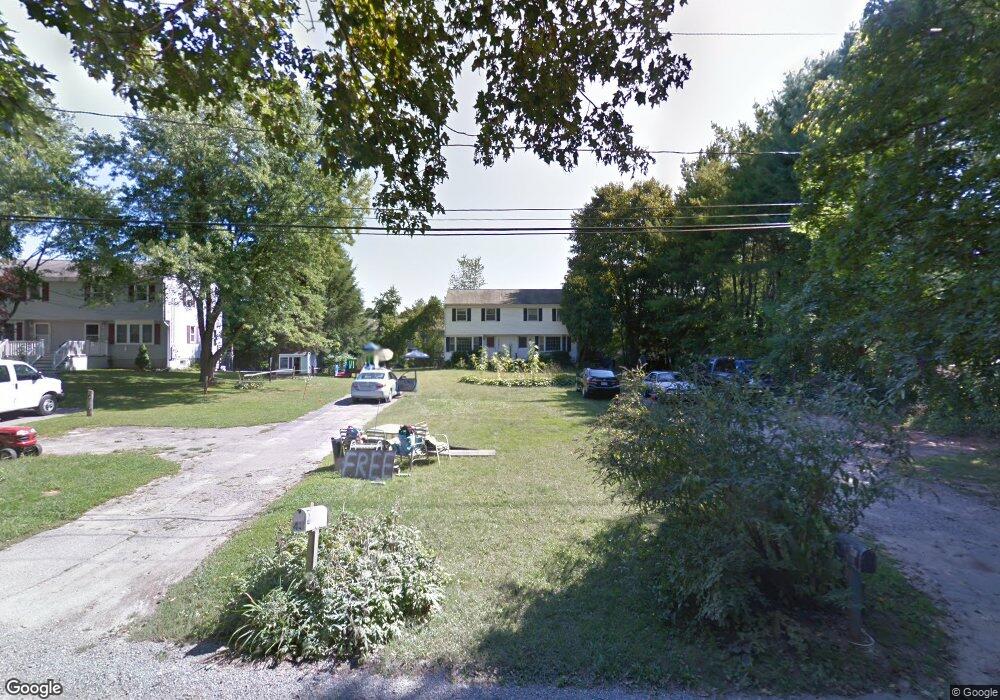
41 Island Rd Unit 43 Millis, MA 02054
Estimated Value: $596,170 - $732,000
5
Beds
3
Baths
2,236
Sq Ft
$304/Sq Ft
Est. Value
About This Home
This home is located at 41 Island Rd Unit 43, Millis, MA 02054 and is currently estimated at $678,793, approximately $303 per square foot. 41 Island Rd Unit 43 is a home located in Norfolk County with nearby schools including Clyde F Brown, Millis Middle School, and Millis High School.
Ownership History
Date
Name
Owned For
Owner Type
Purchase Details
Closed on
Jul 24, 1998
Sold by
Mailman R Lyle and Mailman Susan
Bought by
Hogan Christopher J and Hogan Cheryl M
Current Estimated Value
Home Financials for this Owner
Home Financials are based on the most recent Mortgage that was taken out on this home.
Original Mortgage
$146,600
Outstanding Balance
$29,975
Interest Rate
6.99%
Mortgage Type
Purchase Money Mortgage
Estimated Equity
$648,818
Create a Home Valuation Report for This Property
The Home Valuation Report is an in-depth analysis detailing your home's value as well as a comparison with similar homes in the area
Home Values in the Area
Average Home Value in this Area
Purchase History
| Date | Buyer | Sale Price | Title Company |
|---|---|---|---|
| Hogan Christopher J | $183,250 | -- |
Source: Public Records
Mortgage History
| Date | Status | Borrower | Loan Amount |
|---|---|---|---|
| Open | Hogan Christopher J | $146,600 |
Source: Public Records
Tax History Compared to Growth
Tax History
| Year | Tax Paid | Tax Assessment Tax Assessment Total Assessment is a certain percentage of the fair market value that is determined by local assessors to be the total taxable value of land and additions on the property. | Land | Improvement |
|---|---|---|---|---|
| 2025 | $8,036 | $490,000 | $240,200 | $249,800 |
| 2024 | $7,809 | $475,600 | $221,700 | $253,900 |
| 2023 | $7,542 | $431,200 | $176,700 | $254,500 |
| 2022 | $8,054 | $426,600 | $189,600 | $237,000 |
| 2021 | $6,938 | $353,600 | $163,800 | $189,800 |
| 2020 | $6,654 | $330,400 | $153,100 | $177,300 |
| 2019 | $5,948 | $318,100 | $140,800 | $177,300 |
| 2018 | $5,732 | $318,100 | $140,800 | $177,300 |
| 2017 | $5,279 | $286,600 | $122,300 | $164,300 |
| 2016 | $4,998 | $286,600 | $122,300 | $164,300 |
| 2015 | $4,872 | $286,600 | $122,300 | $164,300 |
Source: Public Records
Map
Nearby Homes