41 J St Unit 12/1-6/30 Hull, MA 02045
The Alphabets NeighborhoodEstimated Value: $641,472 - $698,000
4
Beds
3
Baths
1,512
Sq Ft
$438/Sq Ft
Est. Value
About This Home
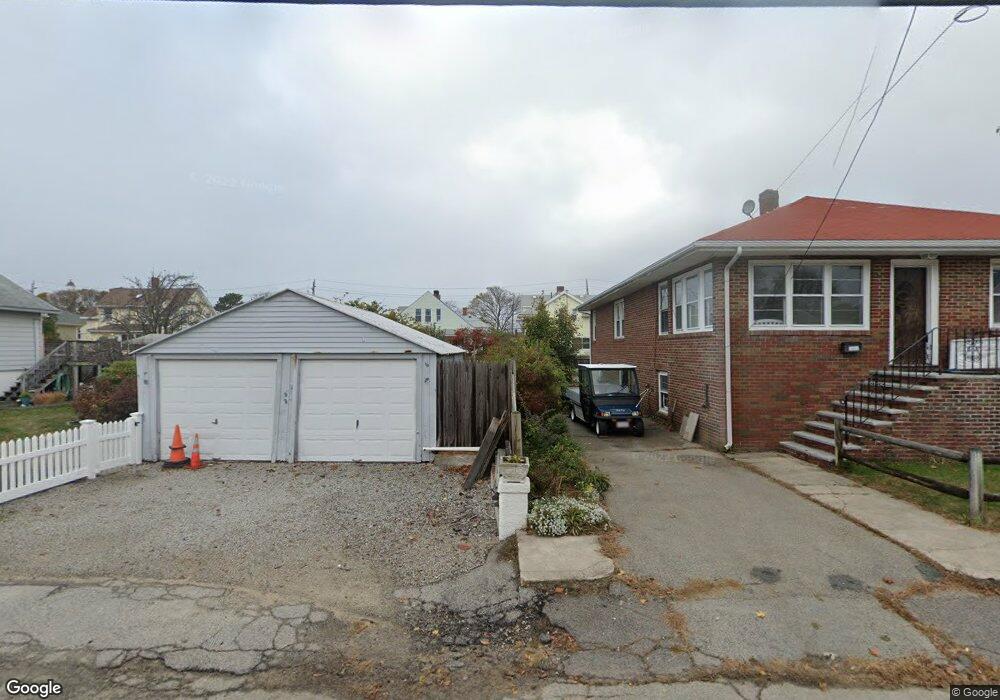
This home is located at 41 J St Unit 12/1-6/30, Hull, MA 02045 and is currently estimated at $661,618, approximately $437 per square foot. 41 J St Unit 12/1-6/30 is a home located in Norfolk County with nearby schools including Lillian M. Jacobs Elementary School, Memorial Middle School, and Hull High School.
Ownership History
Date
Name
Owned For
Owner Type
Purchase Details
Closed on
Jan 25, 2016
Sold by
Rothman Milton
Bought by
Milton L Rothman T L and Milton Rothman
Current Estimated Value
Purchase Details
Closed on
Feb 27, 2014
Sold by
Rothman Morris
Bought by
Rothman Milton
Purchase Details
Closed on
Dec 2, 2011
Sold by
Salamone Janice
Bought by
Rothman Milton and Rothman Morris
Purchase Details
Closed on
Apr 10, 2000
Sold by
Renzetti Nicholas J
Bought by
Salamone Janice
Home Financials for this Owner
Home Financials are based on the most recent Mortgage that was taken out on this home.
Original Mortgage
$143,200
Interest Rate
8.3%
Mortgage Type
Purchase Money Mortgage
Create a Home Valuation Report for This Property
The Home Valuation Report is an in-depth analysis detailing your home's value as well as a comparison with similar homes in the area
Home Values in the Area
Average Home Value in this Area
Purchase History
| Date | Buyer | Sale Price | Title Company |
|---|---|---|---|
| Milton L Rothman T L | -- | -- | |
| Rothman Milton | $139,000 | -- | |
| Rothman Milton | $280,000 | -- | |
| Salamone Janice | $179,000 | -- |
Source: Public Records
Mortgage History
| Date | Status | Borrower | Loan Amount |
|---|---|---|---|
| Previous Owner | Salamone Janice | $143,200 | |
| Previous Owner | Salamone Janice | $32,000 |
Source: Public Records
Tax History Compared to Growth
Tax History
| Year | Tax Paid | Tax Assessment Tax Assessment Total Assessment is a certain percentage of the fair market value that is determined by local assessors to be the total taxable value of land and additions on the property. | Land | Improvement |
|---|---|---|---|---|
| 2025 | $6,073 | $542,200 | $226,300 | $315,900 |
| 2024 | $5,604 | $481,000 | $215,900 | $265,100 |
| 2023 | $5,710 | $469,200 | $208,900 | $260,300 |
| 2022 | $5,541 | $441,900 | $195,000 | $246,900 |
| 2021 | $10,017 | $410,800 | $174,100 | $236,700 |
| 2020 | $6,517 | $388,800 | $181,000 | $207,800 |
| 2019 | $4,802 | $368,000 | $167,100 | $200,900 |
| 2018 | $163 | $340,300 | $167,100 | $173,200 |
| 2017 | $4,517 | $329,200 | $167,100 | $162,100 |
| 2016 | $4,250 | $315,300 | $153,200 | $162,100 |
| 2015 | $4,055 | $290,900 | $128,800 | $162,100 |
| 2014 | $3,814 | $275,000 | $118,400 | $156,600 |
Source: Public Records
Map
Nearby Homes