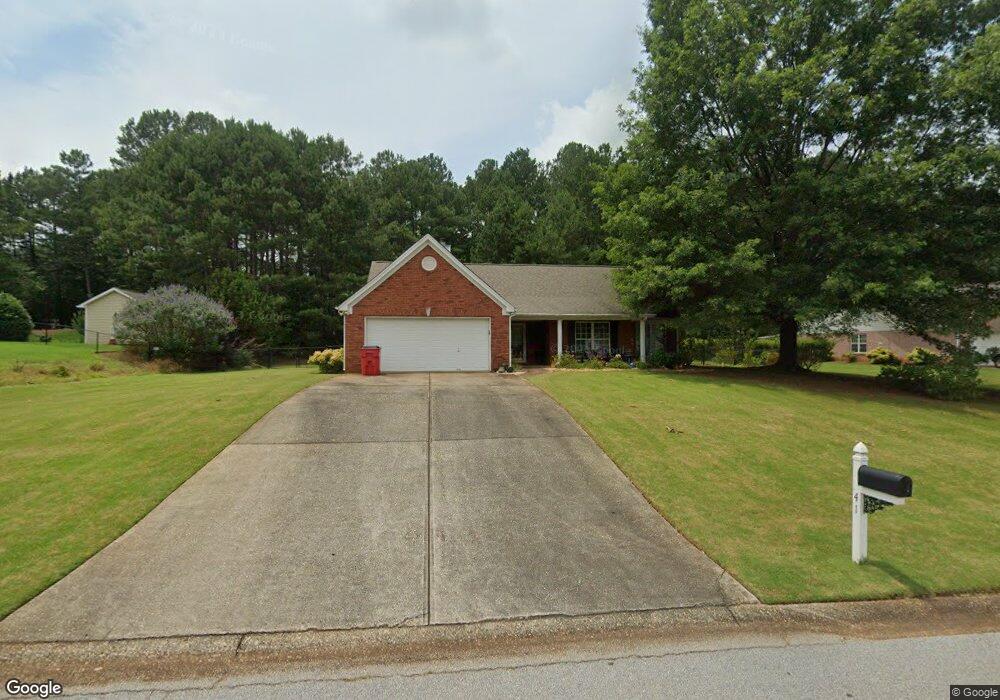
41 Jacob Dr Hoschton, GA 30548
Estimated Value: $340,000 - $380,000
3
Beds
2
Baths
1,930
Sq Ft
$189/Sq Ft
Est. Value
About This Home
This home is located at 41 Jacob Dr, Hoschton, GA 30548 and is currently estimated at $365,486, approximately $189 per square foot. 41 Jacob Dr is a home located in Jackson County with nearby schools including Gum Springs Elementary School, West Jackson Middle School, and Jackson County High School.
Ownership History
Date
Name
Owned For
Owner Type
Purchase Details
Closed on
Jun 16, 2011
Sold by
Federal Home Loan Mortgage Corporation
Bought by
Ellett Shelley A
Current Estimated Value
Home Financials for this Owner
Home Financials are based on the most recent Mortgage that was taken out on this home.
Original Mortgage
$84,000
Outstanding Balance
$57,908
Interest Rate
4.63%
Mortgage Type
New Conventional
Estimated Equity
$307,578
Purchase Details
Closed on
Mar 1, 2011
Sold by
Ortiz-Ortega Angela
Bought by
Wells Fargo Bank Na
Purchase Details
Closed on
Dec 7, 2006
Sold by
Not Provided
Bought by
Ellett Shelley A
Home Financials for this Owner
Home Financials are based on the most recent Mortgage that was taken out on this home.
Original Mortgage
$121,500
Interest Rate
6.31%
Mortgage Type
New Conventional
Purchase Details
Closed on
Apr 5, 2000
Sold by
Bowen Bowen and Bowen Bowen
Bought by
Smith Johnathan P
Purchase Details
Closed on
Mar 15, 1999
Sold by
Gbs Partners
Bought by
Bowen Bowen and Bowen Bowen
Create a Home Valuation Report for This Property
The Home Valuation Report is an in-depth analysis detailing your home's value as well as a comparison with similar homes in the area
Home Values in the Area
Average Home Value in this Area
Purchase History
| Date | Buyer | Sale Price | Title Company |
|---|---|---|---|
| Ellett Shelley A | $105,000 | -- | |
| Wells Fargo Bank Na | $95,666 | -- | |
| Ellett Shelley A | $162,000 | -- | |
| Smith Johnathan P | $129,000 | -- | |
| Bowen Bowen | $322,500 | -- |
Source: Public Records
Mortgage History
| Date | Status | Borrower | Loan Amount |
|---|---|---|---|
| Open | Wells Fargo Bank Na | $84,000 | |
| Previous Owner | Ellett Shelley A | $121,500 |
Source: Public Records
Tax History Compared to Growth
Tax History
| Year | Tax Paid | Tax Assessment Tax Assessment Total Assessment is a certain percentage of the fair market value that is determined by local assessors to be the total taxable value of land and additions on the property. | Land | Improvement |
|---|---|---|---|---|
| 2024 | $973 | $107,280 | $23,200 | $84,080 |
| 2023 | $1,985 | $97,400 | $23,200 | $74,200 |
| 2022 | $1,491 | $84,080 | $23,200 | $60,880 |
| 2021 | $1,166 | $72,480 | $11,600 | $60,880 |
| 2020 | $893 | $60,840 | $11,600 | $49,240 |
| 2019 | $907 | $60,840 | $11,600 | $49,240 |
| 2018 | $1,687 | $58,480 | $11,600 | $46,880 |
| 2017 | $1,658 | $57,195 | $11,600 | $45,595 |
| 2016 | $1,775 | $55,024 | $11,600 | $43,424 |
| 2015 | $1,653 | $51,424 | $8,000 | $43,424 |
| 2014 | $1,247 | $39,186 | $8,000 | $31,186 |
| 2013 | -- | $39,186 | $8,000 | $31,186 |
Source: Public Records
Map
Nearby Homes
- 5896 Woodland Park Ct
- 5883 Woodland Park Ct
- 3844 Cheyenne Ln
- 5895 Woodland Park Ct
- 3838 Cheyenne Ln
- 3832 Cheyenne Ln
- 3847 Cheyenne Ln
- 5717 Meadow View Dr
- 3787 Cheyenne Ln
- 131 Canix Ln
- 3766 Cheyenne Ln
- 3769 Cheyenne Ln
- 6117 Golf View Ct
- 6118 Golf View Ct
- 3748 Cheyenne Ln
- 5676 Meadow View Dr
- 3745 Cheyenne Ln
- 6075 Fairway Park Ln
- 5612 Meadow View Dr
- 5648 Meadow View Dr