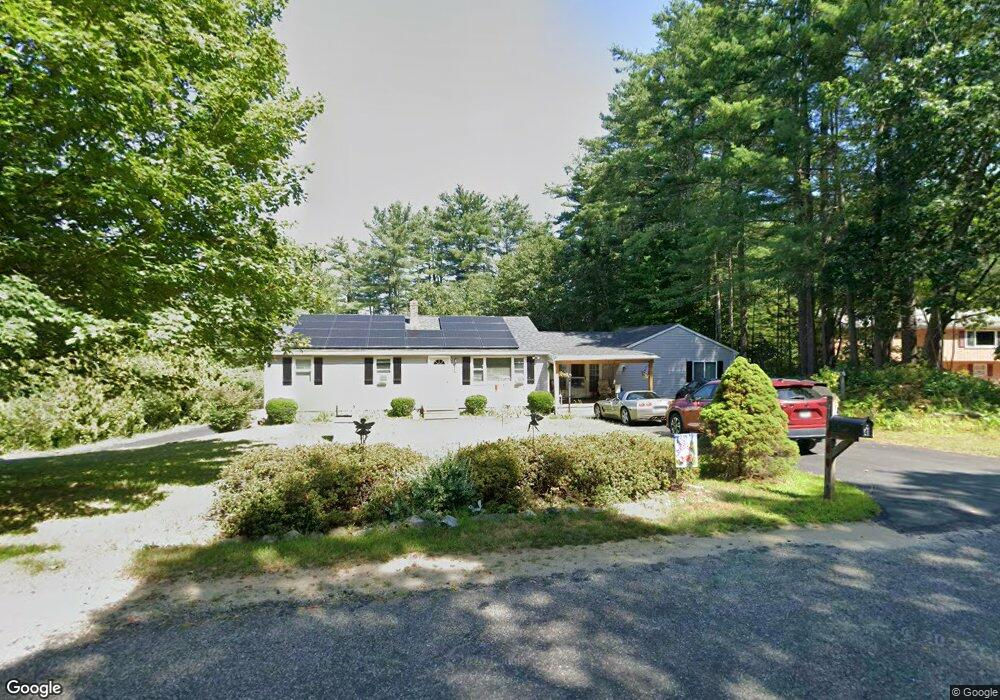
41 Johnson Rd Orange, MA 01364
Estimated Value: $328,000 - $380,644
3
Beds
2
Baths
1,176
Sq Ft
$302/Sq Ft
Est. Value
About This Home
This home is located at 41 Johnson Rd, Orange, MA 01364 and is currently estimated at $355,661, approximately $302 per square foot. 41 Johnson Rd is a home located in Franklin County with nearby schools including Fisher Hill and Ralph C Mahar Regional School.
Ownership History
Date
Name
Owned For
Owner Type
Purchase Details
Closed on
May 26, 2006
Sold by
Wood Olga M
Bought by
Bonk Stephen E and Bonk Tyara M
Current Estimated Value
Home Financials for this Owner
Home Financials are based on the most recent Mortgage that was taken out on this home.
Original Mortgage
$193,700
Outstanding Balance
$111,785
Interest Rate
6.53%
Mortgage Type
Purchase Money Mortgage
Estimated Equity
$243,876
Purchase Details
Closed on
May 29, 1991
Sold by
Mclaughlin Jon C
Bought by
Wood Thomas W and Wood Olga M
Create a Home Valuation Report for This Property
The Home Valuation Report is an in-depth analysis detailing your home's value as well as a comparison with similar homes in the area
Home Values in the Area
Average Home Value in this Area
Purchase History
| Date | Buyer | Sale Price | Title Company |
|---|---|---|---|
| Bonk Stephen E | $203,900 | -- | |
| Wood Thomas W | $98,500 | -- |
Source: Public Records
Mortgage History
| Date | Status | Borrower | Loan Amount |
|---|---|---|---|
| Open | Bonk Stephen E | $193,700 |
Source: Public Records
Tax History
| Year | Tax Paid | Tax Assessment Tax Assessment Total Assessment is a certain percentage of the fair market value that is determined by local assessors to be the total taxable value of land and additions on the property. | Land | Improvement |
|---|---|---|---|---|
| 2025 | $6,037 | $367,000 | $32,700 | $334,300 |
| 2024 | $5,389 | $309,000 | $32,700 | $276,300 |
| 2023 | $5,311 | $295,700 | $32,700 | $263,000 |
| 2022 | $4,920 | $257,300 | $32,700 | $224,600 |
| 2021 | $4,263 | $212,600 | $49,400 | $163,200 |
| 2020 | $4,178 | $205,500 | $49,000 | $156,500 |
| 2019 | $3,664 | $162,700 | $42,700 | $120,000 |
| 2018 | $3,442 | $156,900 | $39,800 | $117,100 |
| 2017 | $3,331 | $156,900 | $39,800 | $117,100 |
| 2016 | $3,353 | $154,500 | $39,800 | $114,700 |
| 2015 | $3,136 | $151,000 | $39,800 | $111,200 |
| 2014 | $3,054 | $154,700 | $39,800 | $114,900 |
Source: Public Records
Map
Nearby Homes
Your Personal Tour Guide
Ask me questions while you tour the home.