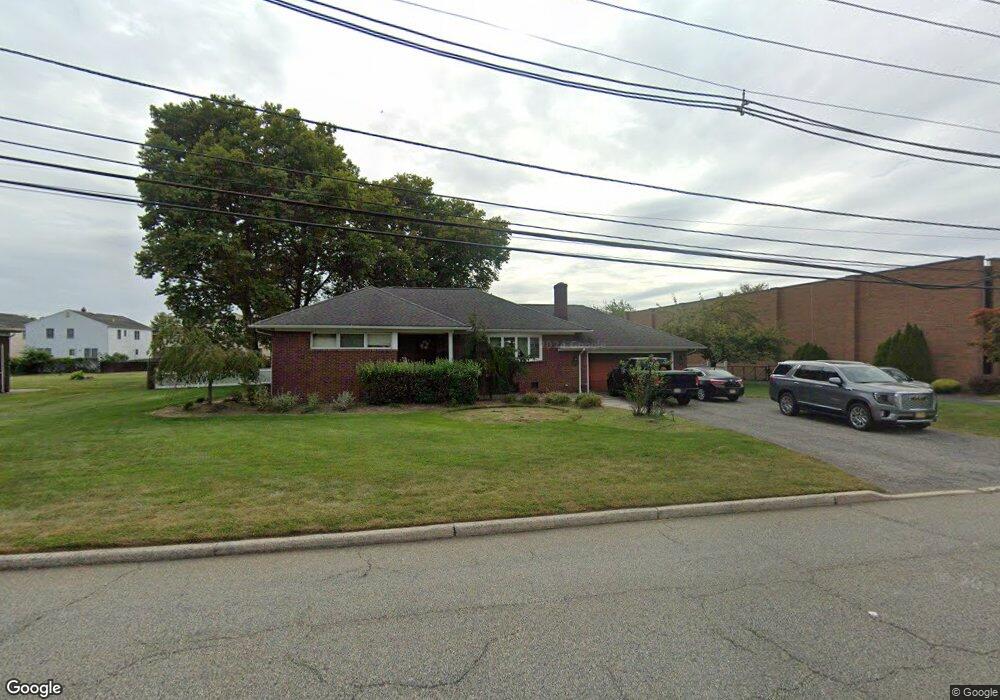
41 Joseph St Moonachie, NJ 07074
Estimated Value: $670,000 - $989,000
--
Bed
--
Bath
1,876
Sq Ft
$449/Sq Ft
Est. Value
About This Home
This home is located at 41 Joseph St, Moonachie, NJ 07074 and is currently estimated at $842,281, approximately $448 per square foot. 41 Joseph St is a home located in Bergen County with nearby schools including Mr. Robert L. Craig Elementary School and George Washington School.
Ownership History
Date
Name
Owned For
Owner Type
Purchase Details
Closed on
Mar 8, 2011
Sold by
Atltm Llc
Bought by
Martinez Manuel and Martinez Donna
Current Estimated Value
Home Financials for this Owner
Home Financials are based on the most recent Mortgage that was taken out on this home.
Original Mortgage
$600,000
Interest Rate
5.07%
Mortgage Type
Purchase Money Mortgage
Purchase Details
Closed on
Jan 15, 1998
Sold by
Berardo Florindo
Bought by
Tucci John J
Create a Home Valuation Report for This Property
The Home Valuation Report is an in-depth analysis detailing your home's value as well as a comparison with similar homes in the area
Home Values in the Area
Average Home Value in this Area
Purchase History
| Date | Buyer | Sale Price | Title Company |
|---|---|---|---|
| Martinez Manuel | $680,000 | -- | |
| Tucci John J | $125,000 | -- |
Source: Public Records
Mortgage History
| Date | Status | Borrower | Loan Amount |
|---|---|---|---|
| Closed | Martinez Manuel | $600,000 |
Source: Public Records
Tax History Compared to Growth
Tax History
| Year | Tax Paid | Tax Assessment Tax Assessment Total Assessment is a certain percentage of the fair market value that is determined by local assessors to be the total taxable value of land and additions on the property. | Land | Improvement |
|---|---|---|---|---|
| 2025 | $14,478 | $829,300 | $380,400 | $448,900 |
| 2024 | $13,960 | $792,000 | $365,100 | $426,900 |
| 2023 | $13,865 | $691,100 | $311,500 | $379,600 |
| 2022 | $13,865 | $642,200 | $273,300 | $368,900 |
| 2021 | $13,653 | $594,900 | $254,200 | $340,700 |
| 2020 | $13,330 | $577,800 | $246,500 | $331,300 |
| 2019 | $13,182 | $570,400 | $242,700 | $327,700 |
| 2018 | $13,581 | $560,500 | $238,900 | $321,600 |
| 2017 | $13,268 | $550,300 | $235,000 | $315,300 |
| 2016 | $12,911 | $542,700 | $231,200 | $311,500 |
| 2015 | $12,033 | $570,000 | $373,300 | $196,700 |
| 2014 | $11,406 | $570,000 | $373,300 | $196,700 |
Source: Public Records
Map
Nearby Homes
- 70 Bruno St
- 2 Lincoln Place
- 28 Ramella Ave
- 70 Christina St
- 80 Union Ave
- 26 Christina St
- 16 Elizabeth Ct
- 16 Liberty St
- 103 Niehaus Ave
- 40 Eckel Rd
- 23 Robby Rd
- 89 Liberty St
- 28 Niehaus Ave
- 95 Redneck Ave
- 93 Redneck Ave
- 55 Prospect Ave
- 189 Washington Ave
- 17 Chamberlain Ave Unit B
- 12 Columbus Ave
- 113 Franklin St