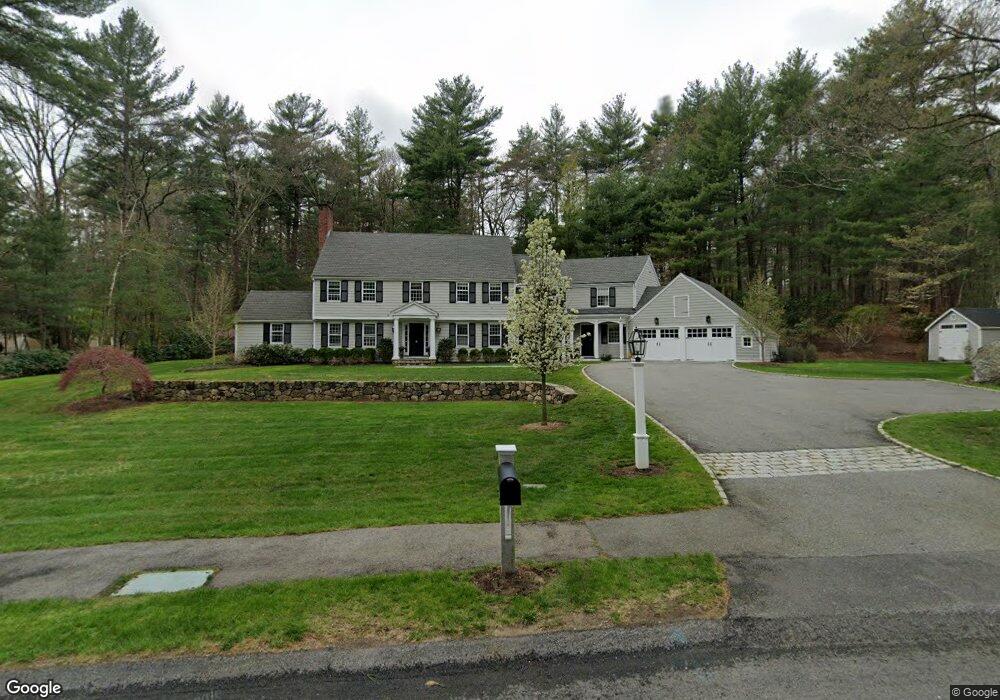
41 Juniper Rd Weston, MA 02493
Estimated Value: $2,462,872 - $2,997,000
4
Beds
4
Baths
4,706
Sq Ft
$568/Sq Ft
Est. Value
About This Home
This home is located at 41 Juniper Rd, Weston, MA 02493 and is currently estimated at $2,675,218, approximately $568 per square foot. 41 Juniper Rd is a home located in Middlesex County with nearby schools including Country Elementary School, Woodland Elementary School, and Field Elementary School.
Ownership History
Date
Name
Owned For
Owner Type
Purchase Details
Closed on
Jul 2, 2025
Sold by
Scauzzo Marissa V
Bought by
Marissa V Scauzzo 2021 T V and Marissa Scauzzo
Current Estimated Value
Purchase Details
Closed on
Jul 23, 2019
Sold by
Summersgill Michael J and Summersgill Marissa V
Bought by
Summersgill Marissa V
Purchase Details
Closed on
Aug 27, 2010
Sold by
Rosenberg Patricia A
Bought by
Marissa Michael J and Summersgill Marissa V
Home Financials for this Owner
Home Financials are based on the most recent Mortgage that was taken out on this home.
Original Mortgage
$550,000
Interest Rate
4.57%
Mortgage Type
Purchase Money Mortgage
Purchase Details
Closed on
Apr 8, 2004
Sold by
Rosenberg Charles A and Rosenberg Patricia A
Bought by
Rosenberg Patricia A
Purchase Details
Closed on
Jan 13, 1999
Sold by
Johnston Richard A and Johnston Joahna C
Bought by
Rosenberg Charles A and Rosenberg Patricia A
Purchase Details
Closed on
Jul 1, 1992
Sold by
Howard Anne
Bought by
Johnston Richard A and Johnston Joahna C
Create a Home Valuation Report for This Property
The Home Valuation Report is an in-depth analysis detailing your home's value as well as a comparison with similar homes in the area
Home Values in the Area
Average Home Value in this Area
Purchase History
| Date | Buyer | Sale Price | Title Company |
|---|---|---|---|
| Marissa V Scauzzo 2021 T V | -- | -- | |
| Marissa V Scauzzo 2021 T V | -- | -- | |
| Summersgill Marissa V | -- | -- | |
| Summersgill Marissa V | -- | -- | |
| Marissa Michael J | $1,525,000 | -- | |
| Marissa Michael J | $1,525,000 | -- | |
| Rosenberg Patricia A | -- | -- | |
| Rosenberg Patricia A | -- | -- | |
| Rosenberg Charles A | $930,000 | -- | |
| Johnston Richard A | $660,000 | -- | |
| Johnston Richard A | $660,000 | -- |
Source: Public Records
Mortgage History
| Date | Status | Borrower | Loan Amount |
|---|---|---|---|
| Previous Owner | Marissa Michael J | $550,000 | |
| Previous Owner | Johnston Richard A | $523,500 | |
| Previous Owner | Johnston Richard A | $252,000 |
Source: Public Records
Tax History
| Year | Tax Paid | Tax Assessment Tax Assessment Total Assessment is a certain percentage of the fair market value that is determined by local assessors to be the total taxable value of land and additions on the property. | Land | Improvement |
|---|---|---|---|---|
| 2025 | $21,831 | $1,966,800 | $1,048,200 | $918,600 |
| 2024 | $21,417 | $1,926,000 | $1,048,200 | $877,800 |
| 2023 | $21,609 | $1,825,100 | $1,048,200 | $776,900 |
| 2022 | $21,481 | $1,676,900 | $1,000,800 | $676,100 |
| 2021 | $20,738 | $1,597,700 | $953,400 | $644,300 |
| 2020 | $20,066 | $1,564,000 | $953,400 | $610,600 |
| 2019 | $19,734 | $1,567,400 | $953,400 | $614,000 |
| 2018 | $19,638 | $1,569,800 | $953,400 | $616,400 |
| 2017 | $19,257 | $1,553,000 | $953,400 | $599,600 |
| 2016 | $18,884 | $1,553,000 | $953,400 | $599,600 |
| 2015 | $19,383 | $1,578,400 | $907,800 | $670,600 |
Source: Public Records
Map
Nearby Homes
- 156 Cherry Brook Rd
- 46 Blackburnian Rd
- 63 Sudbury Rd
- 6 Clifford Ln
- 40 Bakers Hill Rd
- 35 Bemis St
- 32 Highland Cir
- 59 Bradyll Rd
- 173 Conant Rd
- 93 Old Sudbury Rd
- 130 Tower Rd
- 81 Montvale Rd
- 101 Draper Rd
- 19 Jericho Rd
- 416 Conant Rd
- 4 Peartree Ln
- 15 Myles Standish Rd
- 291 Concord Rd
- 30 Warren Ave
- 741 Boston Post Rd
Your Personal Tour Guide
Ask me questions while you tour the home.