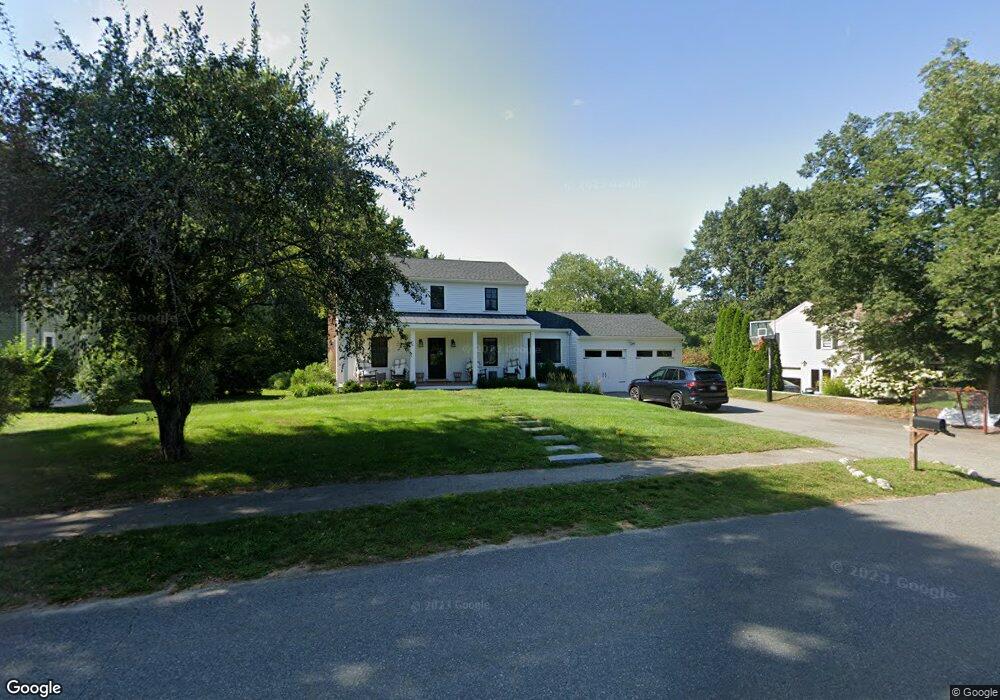
41 Kenney Ln Concord, MA 01742
Estimated Value: $1,077,000 - $1,238,000
3
Beds
2
Baths
1,812
Sq Ft
$650/Sq Ft
Est. Value
About This Home
This home is located at 41 Kenney Ln, Concord, MA 01742 and is currently estimated at $1,178,627, approximately $650 per square foot. 41 Kenney Ln is a home located in Middlesex County with nearby schools including Alcott Elementary School, Concord Middle School, and The Fenn School.
Ownership History
Date
Name
Owned For
Owner Type
Purchase Details
Closed on
Jun 10, 2011
Sold by
Lisa J Sellers Ret and Sellers Lisa J
Bought by
Oneill John F and Oneill Melissa A
Current Estimated Value
Home Financials for this Owner
Home Financials are based on the most recent Mortgage that was taken out on this home.
Original Mortgage
$397,958
Outstanding Balance
$276,650
Interest Rate
4.81%
Mortgage Type
Purchase Money Mortgage
Estimated Equity
$901,977
Purchase Details
Closed on
Jan 24, 2011
Sold by
Sellers Lisa J and Cuoco James A
Bought by
Lisa J Sellers Rt and Sellers Lisa J
Purchase Details
Closed on
Nov 8, 1995
Sold by
Doherty Joseph J and Doherty Nancy T
Bought by
Cuoco James A and Sellers Lisa J
Purchase Details
Closed on
Apr 17, 1991
Sold by
Bldrs Collaborative
Bought by
Doherty Joseph J and Doherty Nancy T
Purchase Details
Closed on
Apr 1, 1991
Sold by
Laverty Stephen R and Laverty Cheryl A
Bought by
Bldrs Collaborative
Create a Home Valuation Report for This Property
The Home Valuation Report is an in-depth analysis detailing your home's value as well as a comparison with similar homes in the area
Home Values in the Area
Average Home Value in this Area
Purchase History
| Date | Buyer | Sale Price | Title Company |
|---|---|---|---|
| Oneill John F | $603,500 | -- | |
| Lisa J Sellers Rt | -- | -- | |
| Cuoco James A | $317,750 | -- | |
| Doherty Joseph J | $254,000 | -- | |
| Bldrs Collaborative | $259,000 | -- |
Source: Public Records
Mortgage History
| Date | Status | Borrower | Loan Amount |
|---|---|---|---|
| Open | Oneill John F | $397,958 | |
| Previous Owner | Bldrs Collaborative | $303,000 | |
| Previous Owner | Bldrs Collaborative | $307,000 |
Source: Public Records
Tax History Compared to Growth
Tax History
| Year | Tax Paid | Tax Assessment Tax Assessment Total Assessment is a certain percentage of the fair market value that is determined by local assessors to be the total taxable value of land and additions on the property. | Land | Improvement |
|---|---|---|---|---|
| 2025 | $148 | $1,115,300 | $569,800 | $545,500 |
| 2024 | $14,145 | $1,077,300 | $531,800 | $545,500 |
| 2023 | $13,296 | $1,025,900 | $506,600 | $519,300 |
| 2022 | $11,827 | $801,300 | $368,400 | $432,900 |
| 2021 | $11,321 | $769,100 | $368,400 | $400,700 |
| 2020 | $9,405 | $660,900 | $322,300 | $338,600 |
| 2019 | $9,133 | $643,600 | $330,800 | $312,800 |
| 2018 | $9,154 | $640,600 | $332,100 | $308,500 |
| 2017 | $8,790 | $624,700 | $316,200 | $308,500 |
| 2016 | $8,196 | $588,800 | $283,800 | $305,000 |
| 2015 | $8,282 | $579,600 | $300,400 | $279,200 |
Source: Public Records
Map
Nearby Homes
- 16 Hatch Farm Ln
- 10 Hatch Farm Ln
- 28 Hatch Farm Ln
- 644 Old Bedford Rd
- 58 Peter Spring Rd
- 86 Butternut Cir
- 6 Parker Rd
- 96 Independence Rd
- 140 Revolutionary Rd
- 646 Cambridge Turnpike
- 35 Chestnut St
- 5 Clark Rd
- 16 Old Cambridge Turnpike
- 5 South Commons Unit D
- 38-40 Court Ln
- 36 Indian Camp Ln Unit D
- 29 S Commons Unit D
- 22 Selfridge Rd
- 61B Walden St
- 9 Garland Rd