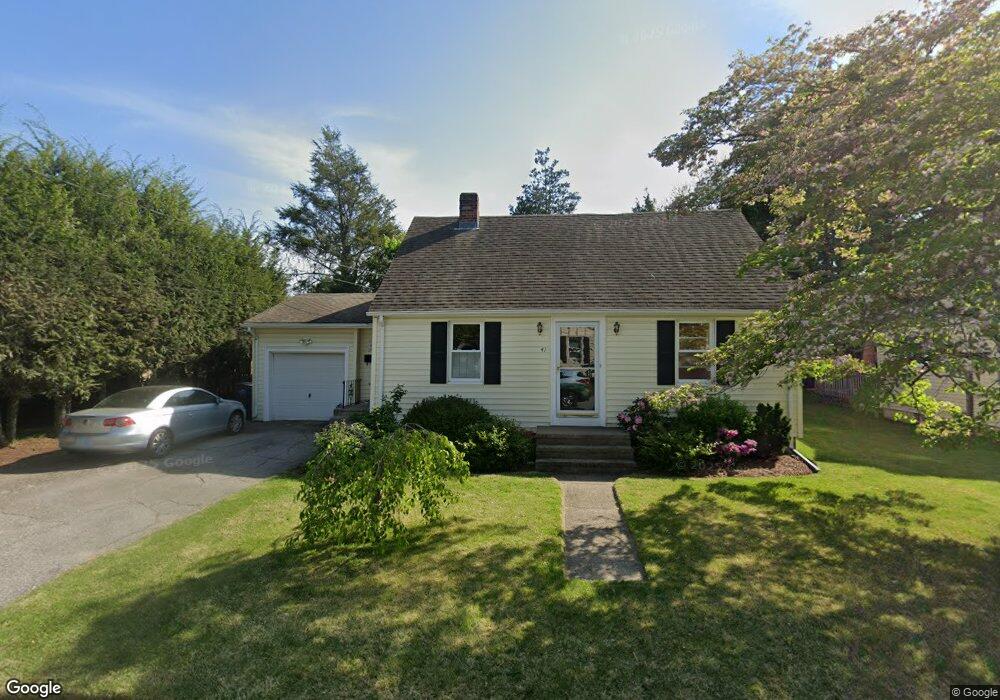
41 Laconia Rd Cranston, RI 02920
Meshanticut NeighborhoodEstimated Value: $438,000 - $517,121
4
Beds
2
Baths
2,476
Sq Ft
$191/Sq Ft
Est. Value
About This Home
This home is located at 41 Laconia Rd, Cranston, RI 02920 and is currently estimated at $472,280, approximately $190 per square foot. 41 Laconia Rd is a home located in Providence County with nearby schools including George J. Peters School, Western Hills Middle School, and Cranston High School West.
Ownership History
Date
Name
Owned For
Owner Type
Purchase Details
Closed on
Dec 20, 2021
Sold by
Wilson Matthew S
Bought by
Smith Allyn L
Current Estimated Value
Home Financials for this Owner
Home Financials are based on the most recent Mortgage that was taken out on this home.
Original Mortgage
$351,204
Outstanding Balance
$321,595
Interest Rate
3.09%
Mortgage Type
Purchase Money Mortgage
Estimated Equity
$150,685
Purchase Details
Closed on
Mar 20, 1995
Sold by
Kdonian Malcolm A
Bought by
Higham Thomas G and Higham Elsa
Create a Home Valuation Report for This Property
The Home Valuation Report is an in-depth analysis detailing your home's value as well as a comparison with similar homes in the area
Home Values in the Area
Average Home Value in this Area
Purchase History
We collect this data history from publicly available records. To have your information removed, we recommend requesting removal directly through your county’s website.
| Date | Buyer | Sale Price | Title Company |
|---|---|---|---|
| Smith Allyn L | $339,000 | None Available | |
| Smith Allyn L | $339,000 | None Available | |
| Higham Thomas G | $115,000 | -- |
Source: Public Records
Mortgage History
We collect this data history from publicly available records. To have your information removed, we recommend requesting removal directly through your county’s website.
| Date | Status | Borrower | Loan Amount |
|---|---|---|---|
| Open | Smith Allyn L | $351,204 | |
| Closed | Smith Allyn L | $351,204 | |
| Previous Owner | Higham Thomas G | $25,000 | |
| Previous Owner | Higham Thomas G | $164,398 | |
| Previous Owner | Higham Thomas G | $163,000 |
Source: Public Records
Tax History
| Year | Tax Paid | Tax Assessment Tax Assessment Total Assessment is a certain percentage of the fair market value that is determined by local assessors to be the total taxable value of land and additions on the property. | Land | Improvement |
|---|---|---|---|---|
| 2025 | $4,875 | $351,200 | $103,900 | $247,300 |
| 2024 | $4,780 | $351,200 | $103,900 | $247,300 |
| 2023 | $4,638 | $245,400 | $71,700 | $173,700 |
| 2022 | $4,542 | $245,400 | $71,700 | $173,700 |
| 2021 | $4,417 | $245,400 | $71,700 | $173,700 |
| 2020 | $4,493 | $216,300 | $75,100 | $141,200 |
| 2019 | $4,493 | $216,300 | $75,100 | $141,200 |
| 2018 | $4,389 | $216,300 | $75,100 | $141,200 |
| 2017 | $4,033 | $175,800 | $61,400 | $114,400 |
| 2016 | $3,947 | $175,800 | $61,400 | $114,400 |
| 2015 | $3,947 | $175,800 | $61,400 | $114,400 |
| 2014 | $3,890 | $170,300 | $61,400 | $108,900 |
Source: Public Records
Map
Nearby Homes
- 148 Wayland Ave
- 11 Bellevue Dr
- 135 Cornell St
- 61 Metropolitan Ave
- 15 Curtis St Unit 104
- 3 Garden Vista Dr Unit 3
- 80 Phenix Ave
- 110 Lake View Rd
- 140 Lake View Rd
- 150 Salem Ave
- 65 Traymore St
- 172 Highland St
- 178 Highland St
- 135 Meshanticut Valley Pkwy
- 60 North St
- 65 Randall St
- 84 N View Ave
- 25 Plaza St
- 115 Hazelton St
- 1455 Park Ave Unit 1
Your Personal Tour Guide
Ask me questions while you tour the home.