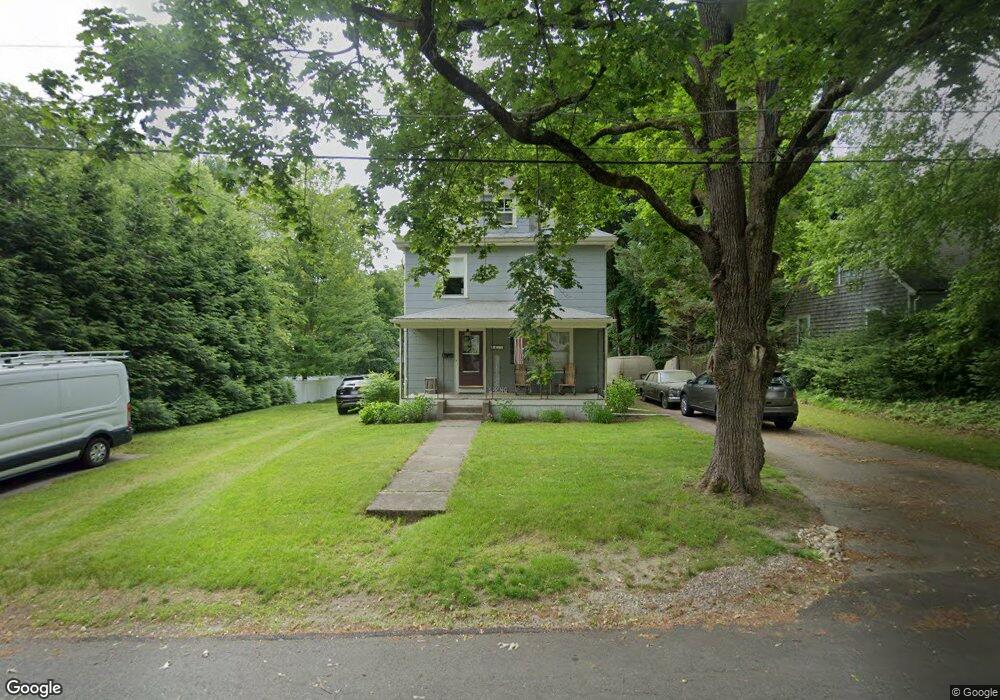
41 Lake Ave Walpole, MA 02081
Estimated Value: $622,547 - $707,000
3
Beds
2
Baths
1,359
Sq Ft
$493/Sq Ft
Est. Value
About This Home
This home is located at 41 Lake Ave, Walpole, MA 02081 and is currently estimated at $669,887, approximately $492 per square foot. 41 Lake Ave is a home located in Norfolk County with nearby schools including Boyden School, Eleanor N. Johnson Middle School, and Walpole High School.
Ownership History
Date
Name
Owned For
Owner Type
Purchase Details
Closed on
Mar 7, 2005
Sold by
Oneil Michael P and Oneil Pamela H
Bought by
Oneil Pamela H
Current Estimated Value
Home Financials for this Owner
Home Financials are based on the most recent Mortgage that was taken out on this home.
Original Mortgage
$160,000
Outstanding Balance
$81,384
Interest Rate
5.66%
Mortgage Type
Purchase Money Mortgage
Estimated Equity
$588,503
Create a Home Valuation Report for This Property
The Home Valuation Report is an in-depth analysis detailing your home's value as well as a comparison with similar homes in the area
Home Values in the Area
Average Home Value in this Area
Purchase History
We collect this data history from publicly available records. To have your information removed, we recommend requesting removal directly through your county’s website.
| Date | Buyer | Sale Price | Title Company |
|---|---|---|---|
| Oneil Pamela H | -- | -- |
Source: Public Records
Mortgage History
We collect this data history from publicly available records. To have your information removed, we recommend requesting removal directly through your county’s website.
| Date | Status | Borrower | Loan Amount |
|---|---|---|---|
| Open | Oneil Pamela H | $160,000 |
Source: Public Records
Tax History
| Year | Tax Paid | Tax Assessment Tax Assessment Total Assessment is a certain percentage of the fair market value that is determined by local assessors to be the total taxable value of land and additions on the property. | Land | Improvement |
|---|---|---|---|---|
| 2025 | $7,327 | $571,100 | $347,600 | $223,500 |
| 2024 | $7,132 | $539,500 | $334,100 | $205,400 |
| 2023 | $6,895 | $496,400 | $290,600 | $205,800 |
| 2022 | $6,508 | $450,100 | $269,100 | $181,000 |
| 2021 | $6,214 | $418,700 | $253,900 | $164,800 |
| 2020 | $6,203 | $413,800 | $239,500 | $174,300 |
| 2019 | $5,903 | $390,900 | $230,300 | $160,600 |
| 2018 | $5,535 | $362,500 | $221,800 | $140,700 |
| 2017 | $5,349 | $348,900 | $213,200 | $135,700 |
| 2016 | $5,079 | $326,400 | $205,000 | $121,400 |
| 2015 | $4,914 | $313,000 | $195,100 | $117,900 |
| 2014 | $4,748 | $301,300 | $195,100 | $106,200 |
Source: Public Records
Map
Nearby Homes
- 29 Clapp St
- 404 Centre Ln
- 10 Country Club Dr
- 24 Riverside Place
- 510 Common St
- 8 Rainbow Pond Dr Unit 5
- 65-67 Diamond St
- 19 Rainbow Pond Dr Unit B2
- 560 Common St
- 2 Rainbow Pond Dr Unit 7
- 142 Baker St
- 120 Spring St
- 1108 Pennington Dr Unit 1108
- 16 Canvasback Way Unit 16
- 2301 Pennington Dr Unit 2301
- 53 Highland St
- 635 Old Post Rd Unit 303
- 4 Meadow Ln
- 881 Main St Unit 5
- 1391 Main St Unit 305
Your Personal Tour Guide
Ask me questions while you tour the home.