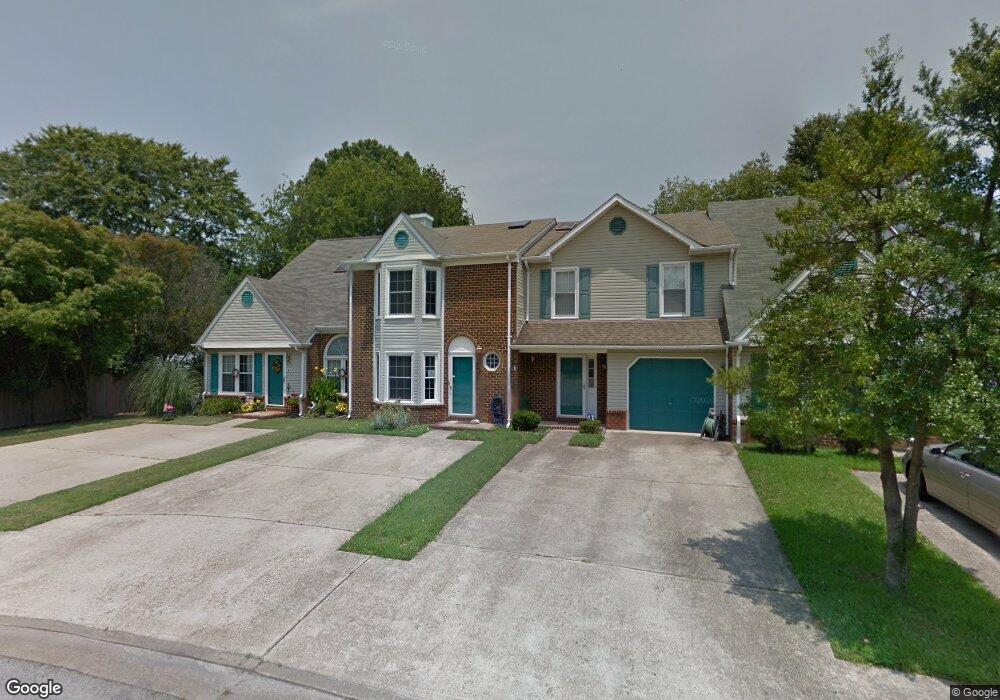
41 Lantern Way Portsmouth, VA 23703
Churchland NeighborhoodEstimated Value: $231,000 - $281,000
2
Beds
3
Baths
1,566
Sq Ft
$162/Sq Ft
Est. Value
About This Home
This home is located at 41 Lantern Way, Portsmouth, VA 23703 and is currently estimated at $253,851, approximately $162 per square foot. 41 Lantern Way is a home located in Portsmouth City with nearby schools including Churchland Academy Elementary School, Churchland Elementary School, and Churchland Middle School.
Ownership History
Date
Name
Owned For
Owner Type
Purchase Details
Closed on
May 13, 2021
Sold by
Aycock Bobby
Bought by
Boone Lorriane A
Current Estimated Value
Home Financials for this Owner
Home Financials are based on the most recent Mortgage that was taken out on this home.
Original Mortgage
$186,459
Outstanding Balance
$168,619
Interest Rate
3.1%
Mortgage Type
FHA
Estimated Equity
$85,232
Purchase Details
Closed on
Mar 11, 2013
Sold by
Secretary Of Veterans Affairs
Bought by
Aycock Bobby
Home Financials for this Owner
Home Financials are based on the most recent Mortgage that was taken out on this home.
Original Mortgage
$103,096
Interest Rate
3.54%
Mortgage Type
FHA
Purchase Details
Closed on
Oct 31, 2005
Sold by
Parks Celeste P
Bought by
Carrier Joseph K
Home Financials for this Owner
Home Financials are based on the most recent Mortgage that was taken out on this home.
Original Mortgage
$169,050
Interest Rate
5.85%
Mortgage Type
VA
Purchase Details
Closed on
Aug 4, 1999
Sold by
Cofer Elise N
Bought by
Hudson Walter R
Home Financials for this Owner
Home Financials are based on the most recent Mortgage that was taken out on this home.
Original Mortgage
$81,800
Interest Rate
7.54%
Create a Home Valuation Report for This Property
The Home Valuation Report is an in-depth analysis detailing your home's value as well as a comparison with similar homes in the area
Home Values in the Area
Average Home Value in this Area
Purchase History
| Date | Buyer | Sale Price | Title Company |
|---|---|---|---|
| Boone Lorriane A | $189,900 | Bay Title Llc | |
| Aycock Bobby | $105,000 | -- | |
| Carrier Joseph K | $165,500 | -- | |
| Hudson Walter R | $90,000 | -- |
Source: Public Records
Mortgage History
| Date | Status | Borrower | Loan Amount |
|---|---|---|---|
| Open | Boone Lorriane A | $186,459 | |
| Previous Owner | Aycock Bobby | $103,096 | |
| Previous Owner | Carrier Joseph K | $169,050 | |
| Previous Owner | Hudson Walter R | $81,800 |
Source: Public Records
Tax History Compared to Growth
Tax History
| Year | Tax Paid | Tax Assessment Tax Assessment Total Assessment is a certain percentage of the fair market value that is determined by local assessors to be the total taxable value of land and additions on the property. | Land | Improvement |
|---|---|---|---|---|
| 2025 | $2,930 | $227,190 | $72,000 | $155,190 |
| 2024 | $2,930 | $224,320 | $72,000 | $152,320 |
| 2023 | $2,786 | $222,880 | $72,000 | $150,880 |
| 2022 | $2,586 | $198,950 | $60,000 | $138,950 |
| 2021 | $2,092 | $160,950 | $22,000 | $138,950 |
| 2020 | $2,092 | $160,950 | $22,000 | $138,950 |
| 2019 | $2,092 | $160,950 | $22,000 | $138,950 |
| 2018 | $2,092 | $160,950 | $22,000 | $138,950 |
| 2017 | $1,904 | $146,460 | $20,740 | $125,720 |
| 2016 | $1,904 | $146,460 | $20,740 | $125,720 |
| 2015 | $1,904 | $146,460 | $20,740 | $125,720 |
| 2014 | $1,860 | $146,460 | $20,740 | $125,720 |
Source: Public Records
Map
Nearby Homes
- 3614 Jordan Ln
- 50 Centre Port Cir
- 3832 New River Reach Unit A
- 17 Centre Port Cir
- 3812 Falling River Reach Unit C
- 4613 Mallard Crescent
- 3609 Linnet Ln
- 122 Keeper St Unit 86
- 3609 Loon Ct
- 2004 Sawgrass Ln
- 1068 Estates Ct
- 137 Lighthouse Dr
- 109 Fresnel Ave Unit 124
- 6 Waterview Ct
- 3822 Wyatt Dr Unit 4
- 109 Faro Ln
- 3814 Wyatt Dr Unit 2
- 3728 Cardinal Ln
- 3307 Monroe St
- 3408 Broadway St