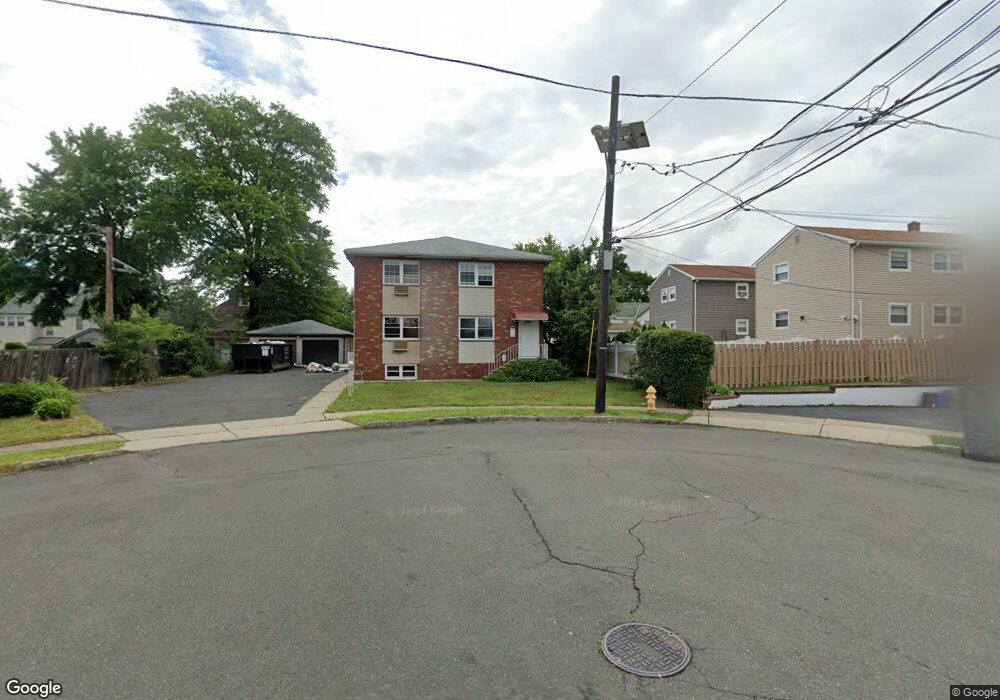
41 Lombard St Unit 3 Bloomfield, NJ 07003
Estimated Value: $719,069 - $872,000
2
Beds
1
Bath
3,264
Sq Ft
$252/Sq Ft
Est. Value
About This Home
This home is located at 41 Lombard St Unit 3, Bloomfield, NJ 07003 and is currently estimated at $823,517, approximately $252 per square foot. 41 Lombard St Unit 3 is a home located in Essex County with nearby schools including Berkeley School, Bloomfield Middle School, and Bloomfield High School.
Ownership History
Date
Name
Owned For
Owner Type
Purchase Details
Closed on
May 1, 2020
Sold by
Singh Suraj R
Bought by
Correia Arletta C
Current Estimated Value
Home Financials for this Owner
Home Financials are based on the most recent Mortgage that was taken out on this home.
Original Mortgage
$588,598
Interest Rate
3.1%
Mortgage Type
FHA
Purchase Details
Closed on
Aug 8, 2006
Sold by
Guarneri Vito D
Bought by
Jones Diaen M and Jons Angelo
Home Financials for this Owner
Home Financials are based on the most recent Mortgage that was taken out on this home.
Original Mortgage
$280,000
Interest Rate
11.5%
Mortgage Type
Adjustable Rate Mortgage/ARM
Create a Home Valuation Report for This Property
The Home Valuation Report is an in-depth analysis detailing your home's value as well as a comparison with similar homes in the area
Home Values in the Area
Average Home Value in this Area
Purchase History
| Date | Buyer | Sale Price | Title Company |
|---|---|---|---|
| Correia Arletta C | $600,000 | Passaic Valley Title Svc Inc | |
| Jones Diaen M | $210,000 | -- |
Source: Public Records
Mortgage History
| Date | Status | Borrower | Loan Amount |
|---|---|---|---|
| Previous Owner | Correia Arletta C | $588,598 | |
| Previous Owner | Jones Diaen M | $280,000 |
Source: Public Records
Tax History Compared to Growth
Tax History
| Year | Tax Paid | Tax Assessment Tax Assessment Total Assessment is a certain percentage of the fair market value that is determined by local assessors to be the total taxable value of land and additions on the property. | Land | Improvement |
|---|---|---|---|---|
| 2025 | $16,657 | $509,700 | $155,100 | $354,600 |
| 2024 | $16,657 | $509,700 | $155,100 | $354,600 |
| 2022 | $16,321 | $509,700 | $155,100 | $354,600 |
| 2021 | $16,020 | $509,700 | $155,100 | $354,600 |
| 2020 | $15,775 | $509,700 | $155,100 | $354,600 |
| 2019 | $16,410 | $412,200 | $143,000 | $269,200 |
| 2018 | $15,804 | $398,700 | $143,000 | $255,700 |
| 2017 | $17,779 | $455,400 | $143,000 | $312,400 |
| 2016 | $17,578 | $455,400 | $143,000 | $312,400 |
| 2015 | $17,419 | $455,400 | $143,000 | $312,400 |
| 2014 | $17,100 | $455,400 | $143,000 | $312,400 |
Source: Public Records
Map
Nearby Homes
- 22 Berkeley Heights Park
- 107 Franklin St
- 32 Fontaine Ave
- 15 Parkway
- 15 Parkway E
- 21 Lexington Ave
- 60 Ella St
- 180 Jerome Place
- 43 Charles St
- 165 Jerome Place
- 200 Montgomery St
- 27-29 Naples Ave
- 27 Naples Ave Unit 29
- 102 Montgomery St Unit 15
- 7 Myrtle St Unit 10
- 109 Sanford Ave
- 109 Sanford Ave Unit 2
- 59-61 Brighton Ave Unit U5
- 59-61 Brighton Ave Unit 5
- 42 La France Ave