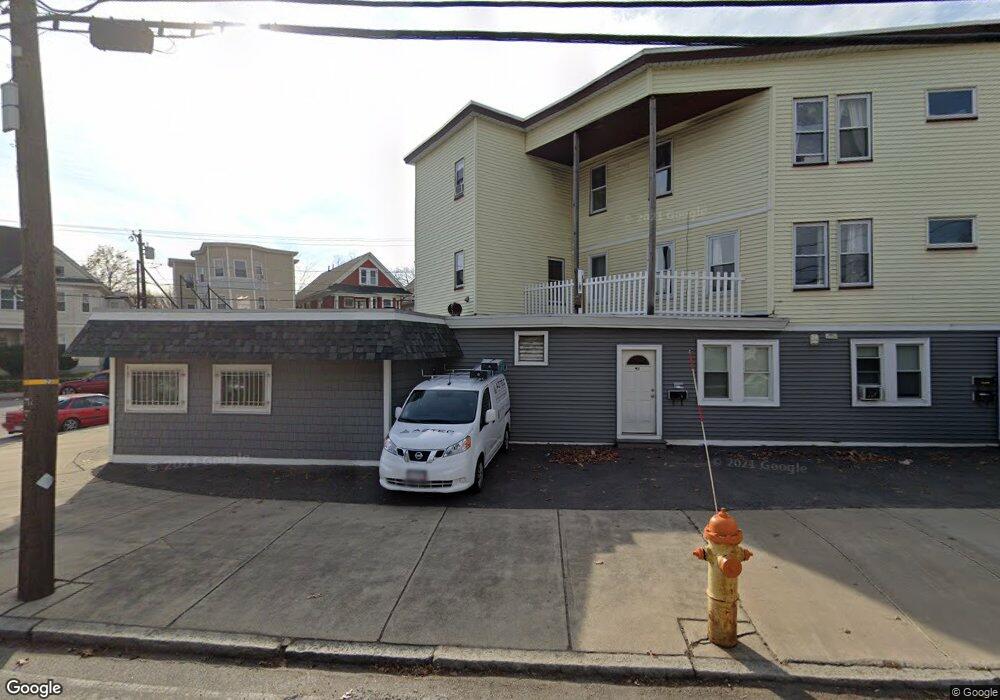
41 Loring St Unit 43 Lawrence, MA 01843
South Common NeighborhoodEstimated Value: $1,106,158
8
Beds
4
Baths
6,043
Sq Ft
$183/Sq Ft
Est. Value
About This Home
This home is located at 41 Loring St Unit 43, Lawrence, MA 01843 and is currently estimated at $1,106,158, approximately $183 per square foot. 41 Loring St Unit 43 is a home located in Essex County with nearby schools including Vardaman Elementary School, Olive Branch Elementary School, and Rowan Elementary School.
Ownership History
Date
Name
Owned For
Owner Type
Purchase Details
Closed on
May 19, 1992
Sold by
Sapienza Angela M
Bought by
Njj Rt
Current Estimated Value
Home Financials for this Owner
Home Financials are based on the most recent Mortgage that was taken out on this home.
Original Mortgage
$100,000
Interest Rate
8.89%
Mortgage Type
Commercial
Create a Home Valuation Report for This Property
The Home Valuation Report is an in-depth analysis detailing your home's value as well as a comparison with similar homes in the area
Home Values in the Area
Average Home Value in this Area
Purchase History
| Date | Buyer | Sale Price | Title Company |
|---|---|---|---|
| Njj Rt | $100,000 | -- | |
| Njj Rt | $100,000 | -- |
Source: Public Records
Mortgage History
| Date | Status | Borrower | Loan Amount |
|---|---|---|---|
| Open | Njj Rt | $40,000 | |
| Closed | Njj Rt | $100,000 |
Source: Public Records
Tax History Compared to Growth
Tax History
| Year | Tax Paid | Tax Assessment Tax Assessment Total Assessment is a certain percentage of the fair market value that is determined by local assessors to be the total taxable value of land and additions on the property. | Land | Improvement |
|---|---|---|---|---|
| 2025 | -- | $846,600 | $169,400 | $677,200 |
| 2024 | -- | $769,400 | $172,800 | $596,600 |
| 2023 | $0 | $651,100 | $144,200 | $506,900 |
| 2022 | $0 | $547,700 | $131,400 | $416,300 |
| 2021 | $0 | $507,200 | $131,400 | $375,800 |
| 2020 | $0 | $494,300 | $121,900 | $372,400 |
| 2019 | $0 | $429,700 | $107,700 | $322,000 |
| 2018 | $0 | $391,000 | $97,500 | $293,500 |
| 2017 | $0 | $365,700 | $84,600 | $281,100 |
| 2016 | -- | $352,300 | $80,500 | $271,800 |
| 2015 | -- | $352,300 | $80,500 | $271,800 |
Source: Public Records
Map
Nearby Homes
- 46 Loring St
- 80 Market St
- 77-79 Shawsheen Rd
- 64 Salem St
- 67-69 Osgood St
- 78-80 Osgood St
- 4 Shawsheen Rd Unit 2
- 75 Beverly St Unit 75
- 317 Middlesex St
- 68 Union St
- 127 Marblehead St Unit A
- 356-360 S Union St
- 57 Glenwood St
- 91 Farnham St
- 7 Stevens Ct
- 27-29 Dorchester St
- 52 Howard St
- 31 Garfield St
- 33 Herrick Rd
- 19-21 Pleasant Terrace
- 41-43 Loring St
- 33-33A Salem St
- 33 Salem St Unit 33A
- 35-39 Loring St
- 35 Loring St Unit 39
- 35 Salem St Unit 35A
- 29 Loring St
- 37 Salem St Unit 37A
- 44 Loring St
- 34 Loring St
- 78 Greenfield St
- 22 Salem St
- 28 Salem St Unit 28A
- 28-2 Salem St
- 24 Salem St Unit 26
- 32 Salem St
- 30 Salem St Unit 30A
- 27 Loring St
- 39 Salem St
- 74 Greenfield St