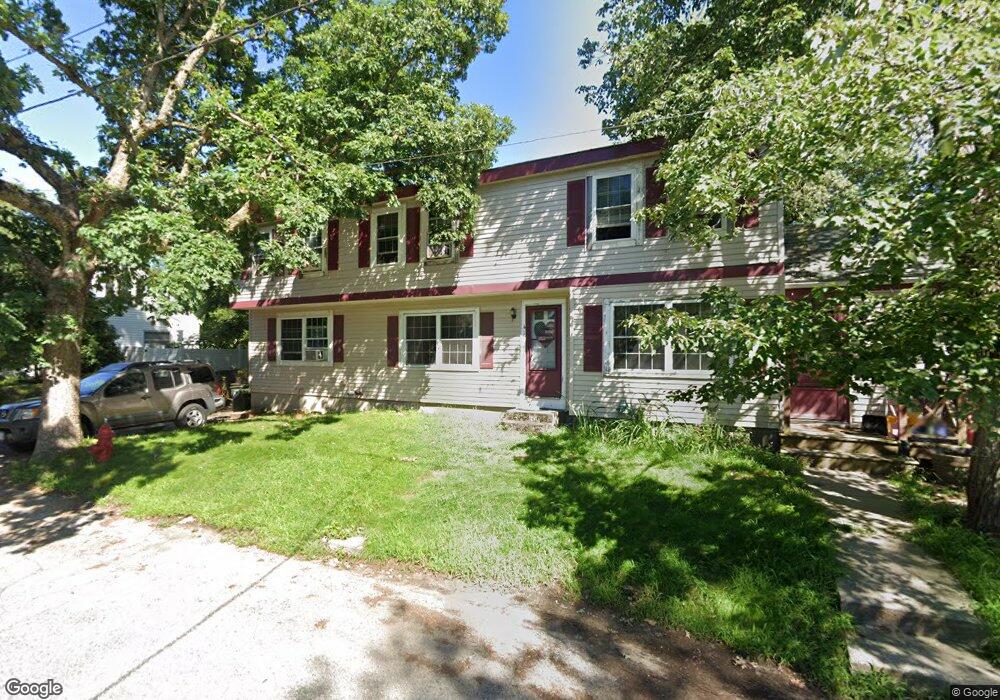
41 Lowland Rd Bellingham, MA 02019
Estimated Value: $472,389 - $529,000
About This Home
This home is located at 41 Lowland Rd, Bellingham, MA 02019 and is currently estimated at $496,847, approximately $321 per square foot. 41 Lowland Rd is a home located in Norfolk County with nearby schools including Joseph F. DiPietro Elementary, Bellingham High School, and Rise Prep Mayoral Academy Middle School.
Ownership History
We collect this data history from publicly available records. To have your information removed, we recommend requesting removal directly through your county’s website.
Purchase Details
Home Values in the Area
Average Home Value in this Area
Purchase History
We collect this data history from publicly available records. To have your information removed, we recommend requesting removal directly through your county’s website.
| Date | Buyer | Sale Price | Title Company |
|---|---|---|---|
| $123,000 | -- | ||
| $123,000 | -- |
Mortgage History
We collect this data history from publicly available records. To have your information removed, we recommend requesting removal directly through your county’s website.
| Date | Status | Borrower | Loan Amount |
|---|---|---|---|
| Open | $10,000 | ||
| Open | $110,000 |
Tax History
We collect this data history from publicly available records. To have your information removed, we recommend requesting removal directly through your county’s website.
| Year | Tax Paid | Tax Assessment Tax Assessment Total Assessment is a certain percentage of the fair market value that is determined by local assessors to be the total taxable value of land and additions on the property. | Land | Improvement |
|---|---|---|---|---|
| 2025 | $4,444 | $353,800 | $124,600 | $229,200 |
| 2024 | $4,245 | $330,100 | $113,700 | $216,400 |
| 2023 | $4,091 | $313,500 | $108,300 | $205,200 |
| 2022 | $4,017 | $285,300 | $90,300 | $195,000 |
| 2021 | $3,872 | $268,700 | $90,300 | $178,400 |
| 2020 | $3,546 | $249,400 | $90,300 | $159,100 |
| 2019 | $3,464 | $243,800 | $90,300 | $153,500 |
| 2018 | $3,228 | $224,000 | $87,800 | $136,200 |
| 2017 | $3,145 | $219,300 | $87,800 | $131,500 |
| 2016 | $2,935 | $205,400 | $90,200 | $115,200 |
| 2015 | $2,836 | $199,000 | $87,400 | $111,600 |
| 2014 | $3,024 | $206,300 | $92,000 | $114,300 |
Map
- 440 Pulaski Blvd
- 450 Pulaski Blvd
- 40 Lowland Rd
- 51 Lowland Rd
- 50 Meadow Rd
- 430 Pulaski Blvd
- 50 Lowland Rd
- 54 Meadow Rd
- 56 Meadow Rd
- 55 Meadow Rd
- 460 Pulaski Blvd
- 481 Pulaski Blvd
- 420 Pulaski Blvd
- 470 Pulaski Blvd
- 61 Woodland Rd
- 461 Pulaski Blvd Unit 491
- 461 Pulaski Blvd
- 461 Pulaski Blvd Unit 461
- 63 Lowland Rd Unit 2
- 471 Pulaski Blvd
Ask me questions while you tour the home.