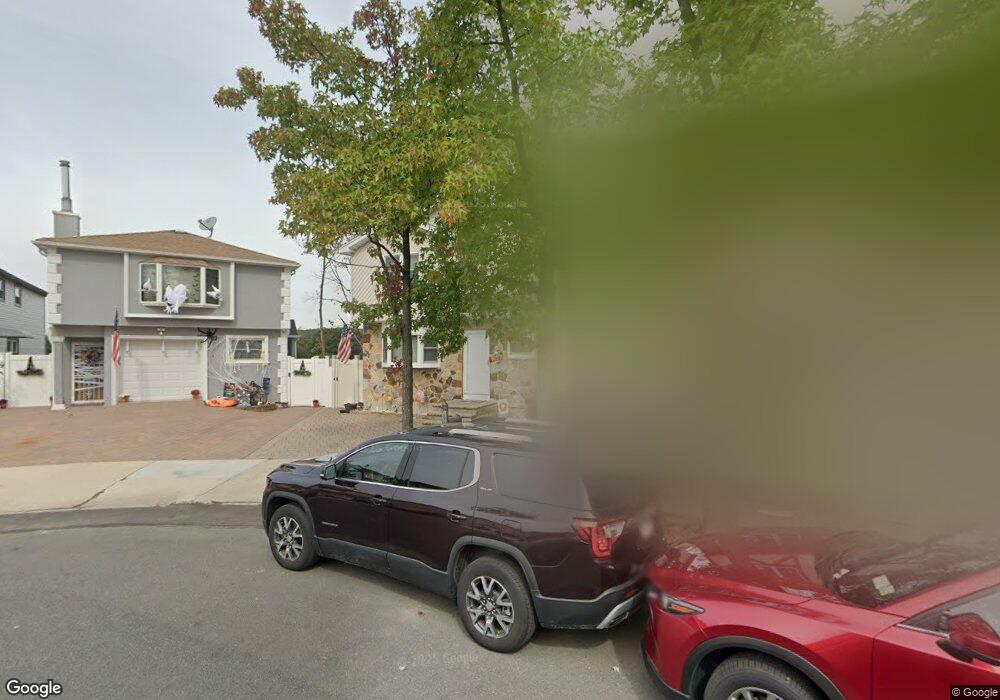
41 Luke Ct Staten Island, NY 10306
Great Kills NeighborhoodEstimated Value: $688,000 - $775,000
3
Beds
2
Baths
1,320
Sq Ft
$561/Sq Ft
Est. Value
About This Home
This home is located at 41 Luke Ct, Staten Island, NY 10306 and is currently estimated at $740,098, approximately $560 per square foot. 41 Luke Ct is a home located in Richmond County with nearby schools including P.S. 50 Frank Hankinson School, Myra S. Barnes Intermediate School 24, and Susan E Wagner High School.
Ownership History
Date
Name
Owned For
Owner Type
Purchase Details
Closed on
Jan 17, 2025
Sold by
Hamilton Charles B and Hamilton Hope C
Bought by
Hamilton Brendan and Hamilton Christina L
Current Estimated Value
Home Financials for this Owner
Home Financials are based on the most recent Mortgage that was taken out on this home.
Original Mortgage
$640,000
Outstanding Balance
$635,641
Interest Rate
6.91%
Mortgage Type
New Conventional
Estimated Equity
$104,457
Purchase Details
Closed on
Aug 27, 1999
Sold by
Pucciarelli Nicholas V and Pucciarelli Laura A
Bought by
Hamilton Charles B and Hamilton Hope C
Home Financials for this Owner
Home Financials are based on the most recent Mortgage that was taken out on this home.
Original Mortgage
$249,750
Interest Rate
7.37%
Create a Home Valuation Report for This Property
The Home Valuation Report is an in-depth analysis detailing your home's value as well as a comparison with similar homes in the area
Home Values in the Area
Average Home Value in this Area
Purchase History
| Date | Buyer | Sale Price | Title Company |
|---|---|---|---|
| Hamilton Brendan | $811,400 | Chicago Title | |
| Hamilton Charles B | $277,500 | -- |
Source: Public Records
Mortgage History
| Date | Status | Borrower | Loan Amount |
|---|---|---|---|
| Open | Hamilton Brendan | $640,000 | |
| Previous Owner | Hamilton Charles B | $249,750 |
Source: Public Records
Tax History Compared to Growth
Tax History
| Year | Tax Paid | Tax Assessment Tax Assessment Total Assessment is a certain percentage of the fair market value that is determined by local assessors to be the total taxable value of land and additions on the property. | Land | Improvement |
|---|---|---|---|---|
| 2025 | $6,317 | $37,920 | $8,290 | $29,630 |
| 2024 | $6,317 | $34,620 | $8,721 | $25,899 |
| 2023 | $6,387 | $31,450 | $8,077 | $23,373 |
| 2022 | $5,741 | $30,420 | $9,600 | $20,820 |
| 2021 | $5,784 | $32,040 | $9,600 | $22,440 |
| 2020 | $5,480 | $27,660 | $9,600 | $18,060 |
| 2019 | $5,190 | $26,940 | $9,600 | $17,340 |
| 2018 | $5,045 | $26,208 | $9,381 | $16,827 |
| 2017 | $4,909 | $25,550 | $8,906 | $16,644 |
| 2016 | $4,509 | $24,104 | $9,594 | $14,510 |
| 2015 | $2,685 | $22,740 | $7,980 | $14,760 |
| 2014 | $2,685 | $21,840 | $7,980 | $13,860 |
Source: Public Records
Map
Nearby Homes