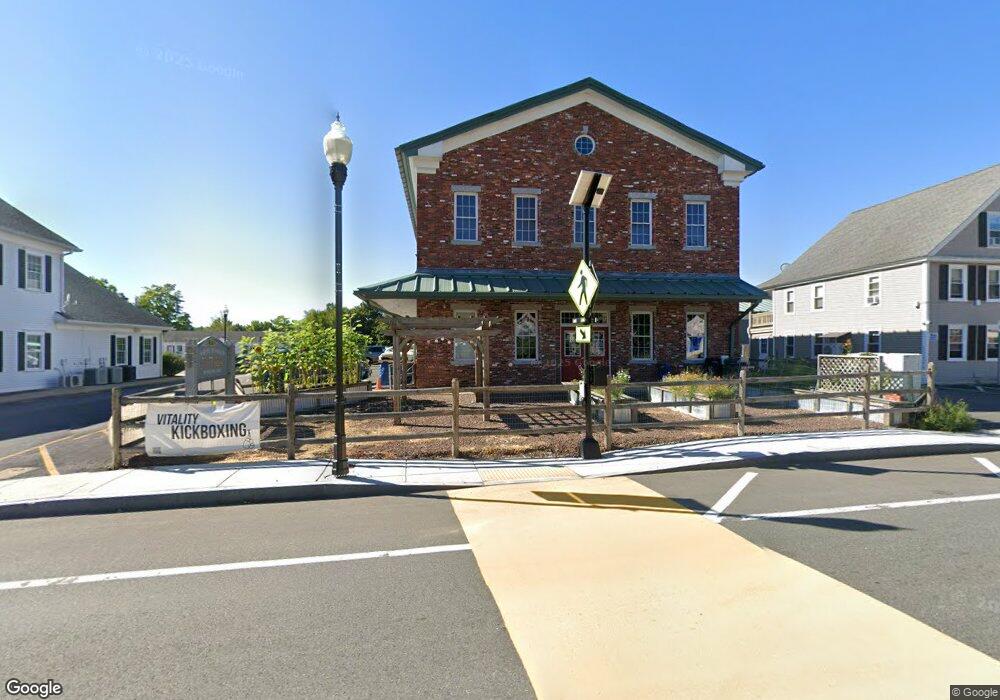
41 Main St Ashburnham, MA 01430
2
Beds
2
Baths
13,800
Sq Ft
1.11
Acres Lot
About This Home
This home is located at 41 Main St, Ashburnham, MA 01430. 41 Main St is a home located in Worcester County with nearby schools including Oakmont Regional High School and Cushing Academy.
Ownership History
Date
Name
Owned For
Owner Type
Purchase Details
Closed on
Apr 29, 2019
Sold by
Wright Ft and Wright
Bought by
Wright Property Invests
Purchase Details
Closed on
Aug 9, 2012
Sold by
Ashburnham Town Of
Bought by
Richard Wright Ft and Wright
Purchase Details
Closed on
Jun 25, 2003
Sold by
Peterborough Oil Co In
Bought by
Richard Wright Ft and Wright
Home Financials for this Owner
Home Financials are based on the most recent Mortgage that was taken out on this home.
Original Mortgage
$200,000
Interest Rate
5.53%
Mortgage Type
Commercial
Create a Home Valuation Report for This Property
The Home Valuation Report is an in-depth analysis detailing your home's value as well as a comparison with similar homes in the area
Home Values in the Area
Average Home Value in this Area
Purchase History
We collect this data history from publicly available records. To have your information removed, we recommend requesting removal directly through your county’s website.
| Date | Buyer | Sale Price | Title Company |
|---|---|---|---|
| Wright Property Invests | -- | -- | |
| Wright Property Invests | -- | -- | |
| Richard Wright Ft | -- | -- | |
| Richard Wright Ft | -- | -- | |
| Richard Wright Ft | -- | -- | |
| Richard Wright Ft | $500,000 | -- | |
| Richard Wright Ft | $500,000 | -- | |
| Richard Wright Ft | $500,000 | -- |
Source: Public Records
Mortgage History
We collect this data history from publicly available records. To have your information removed, we recommend requesting removal directly through your county’s website.
| Date | Status | Borrower | Loan Amount |
|---|---|---|---|
| Previous Owner | Richard Wright Ft | $200,000 |
Source: Public Records
Tax History
| Year | Tax Paid | Tax Assessment Tax Assessment Total Assessment is a certain percentage of the fair market value that is determined by local assessors to be the total taxable value of land and additions on the property. | Land | Improvement |
|---|---|---|---|---|
| 2025 | $14,869 | $999,900 | $71,000 | $928,900 |
| 2024 | $15,397 | $977,600 | $71,000 | $906,600 |
| 2023 | $15,779 | $953,400 | $71,000 | $882,400 |
| 2022 | $16,562 | $877,200 | $71,000 | $806,200 |
| 2021 | $17,186 | $836,300 | $70,000 | $766,300 |
| 2020 | $16,810 | $836,300 | $70,000 | $766,300 |
| 2019 | $18,859 | $836,300 | $70,000 | $766,300 |
| 2018 | $19,490 | $832,900 | $66,600 | $766,300 |
| 2017 | $17,901 | $779,300 | $59,500 | $719,800 |
| 2016 | $17,390 | $764,400 | $58,100 | $706,300 |
| 2015 | $17,031 | $764,400 | $58,100 | $706,300 |
Source: Public Records
Map
Nearby Homes
- 14 Central St
- 100 Main St
- 9 Willard Rd
- 17 Fairview Ave
- 18 Fairview Ave
- 46 Fitchburg Rd
- 75 Willard Rd
- 57 Ashby Rd
- 189 Fitchburg Rd
- 101 Williams Rd
- 159 Ashby Rd
- 130 Center St
- 213 Ashby Rd
- 5 Russell Ave
- Lot 40C Winchendon Rd
- Lot 3 W State Rd
- 149 Bragg Hill Rd
- 15 Kirali Ct
- M41-L13E Rindge Turnpike Rd
- 63 Murray Rd
Your Personal Tour Guide
Ask me questions while you tour the home.