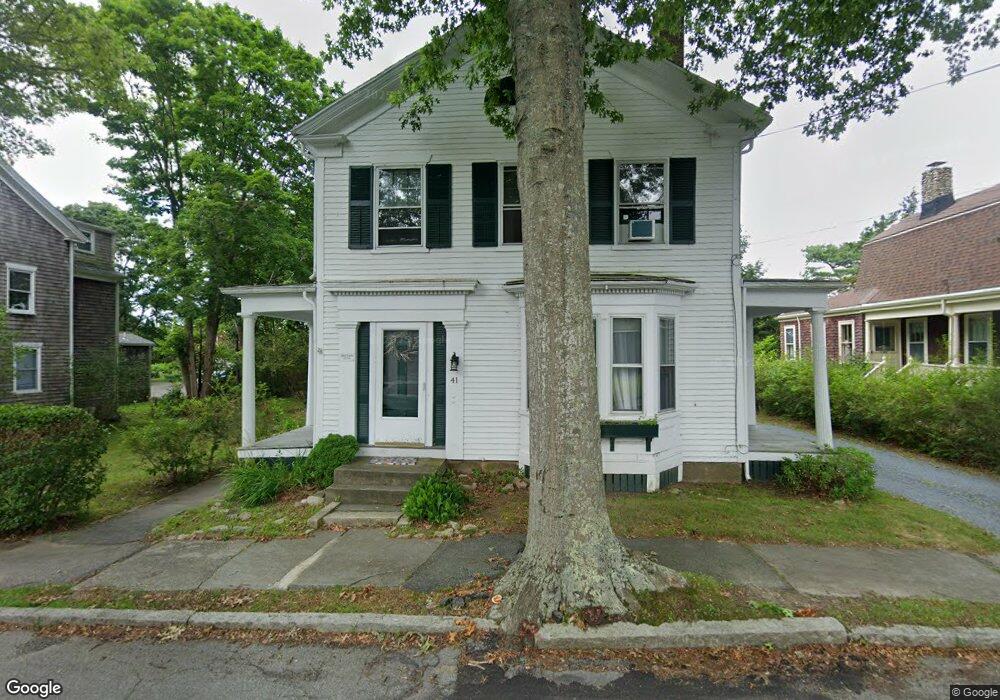
41 Main St Unit 2 Mattapoisett, MA 02739
Estimated Value: $615,000 - $862,000
2
Beds
1
Bath
960
Sq Ft
$744/Sq Ft
Est. Value
About This Home
This home is located at 41 Main St Unit 2, Mattapoisett, MA 02739 and is currently estimated at $713,765, approximately $743 per square foot. 41 Main St Unit 2 is a home located in Plymouth County with nearby schools including Center School, Old Hammondtown Elementary, and Old Rochester Regional High School.
Ownership History
Date
Name
Owned For
Owner Type
Purchase Details
Closed on
Apr 23, 2020
Sold by
Buzzards Bay Management
Bought by
Bungert Ethan D
Current Estimated Value
Purchase Details
Closed on
Sep 29, 2016
Sold by
Kaiser Ned A
Bought by
Buzzards Bay Managemen
Purchase Details
Closed on
Jun 13, 2014
Sold by
Rubin Andrew A and Rubin Margaret M
Bought by
Kaiser Ned A
Home Financials for this Owner
Home Financials are based on the most recent Mortgage that was taken out on this home.
Original Mortgage
$304,000
Interest Rate
4.27%
Mortgage Type
New Conventional
Purchase Details
Closed on
May 13, 2005
Sold by
Byron P Dunn Nt and Dunn Charles B
Bought by
Rubin Andrew A and Rubin Margaret M
Home Financials for this Owner
Home Financials are based on the most recent Mortgage that was taken out on this home.
Original Mortgage
$340,000
Interest Rate
6.05%
Mortgage Type
Purchase Money Mortgage
Create a Home Valuation Report for This Property
The Home Valuation Report is an in-depth analysis detailing your home's value as well as a comparison with similar homes in the area
Home Values in the Area
Average Home Value in this Area
Purchase History
| Date | Buyer | Sale Price | Title Company |
|---|---|---|---|
| Bungert Ethan D | $400,000 | None Available | |
| Bungert Ethan D | $400,000 | None Available | |
| Buzzards Bay Managemen | $425,000 | -- | |
| Buzzards Bay Managemen | $425,000 | -- | |
| Kaiser Ned A | $380,000 | -- | |
| Kaiser Ned A | $380,000 | -- | |
| Rubin Andrew A | $425,000 | -- | |
| Rubin Andrew A | $425,000 | -- |
Source: Public Records
Mortgage History
| Date | Status | Borrower | Loan Amount |
|---|---|---|---|
| Previous Owner | Kaiser Ned A | $304,000 | |
| Previous Owner | Rubin Andrew A | $340,000 |
Source: Public Records
Tax History Compared to Growth
Tax History
| Year | Tax Paid | Tax Assessment Tax Assessment Total Assessment is a certain percentage of the fair market value that is determined by local assessors to be the total taxable value of land and additions on the property. | Land | Improvement |
|---|---|---|---|---|
| 2025 | $5,603 | $520,700 | $330,700 | $190,000 |
| 2024 | $5,473 | $520,700 | $330,700 | $190,000 |
| 2023 | $5,048 | $448,700 | $317,300 | $131,400 |
| 2022 | $4,757 | $383,600 | $251,800 | $131,800 |
| 2021 | $5,154 | $397,700 | $251,800 | $145,900 |
| 2020 | $5,907 | $437,900 | $239,800 | $198,100 |
| 2019 | $5,769 | $436,700 | $239,800 | $196,900 |
| 2018 | $4,837 | $371,500 | $237,000 | $134,500 |
| 2017 | $4,623 | $353,700 | $219,200 | $134,500 |
| 2016 | $4,591 | $347,800 | $199,100 | $148,700 |
| 2015 | $4,429 | $340,700 | $192,000 | $148,700 |
| 2014 | $3,915 | $307,800 | $169,400 | $138,400 |
Source: Public Records
Map
Nearby Homes
- 7 Pearl St
- 9 Hitching Post Rd
- 12 Cannon St
- 35 North St
- 47 Fairhaven Rd
- 8 Captains Ln
- 11 Captains Ln
- 13 Park Place
- 52 Prince Snow Cir
- 83 Fairhaven Rd
- 15 Ned's Point Rd
- 0 Whalers Way
- 1 Starboard Way
- 41 Starboard Way
- 0 Harbor Acres Ln - Lot B
- 3 Brandt Island Rd
- 19 High Ridge Dr
- 31 Split Rock Ln
- 3 Rock St
- 6 Ocean Breeze Ln