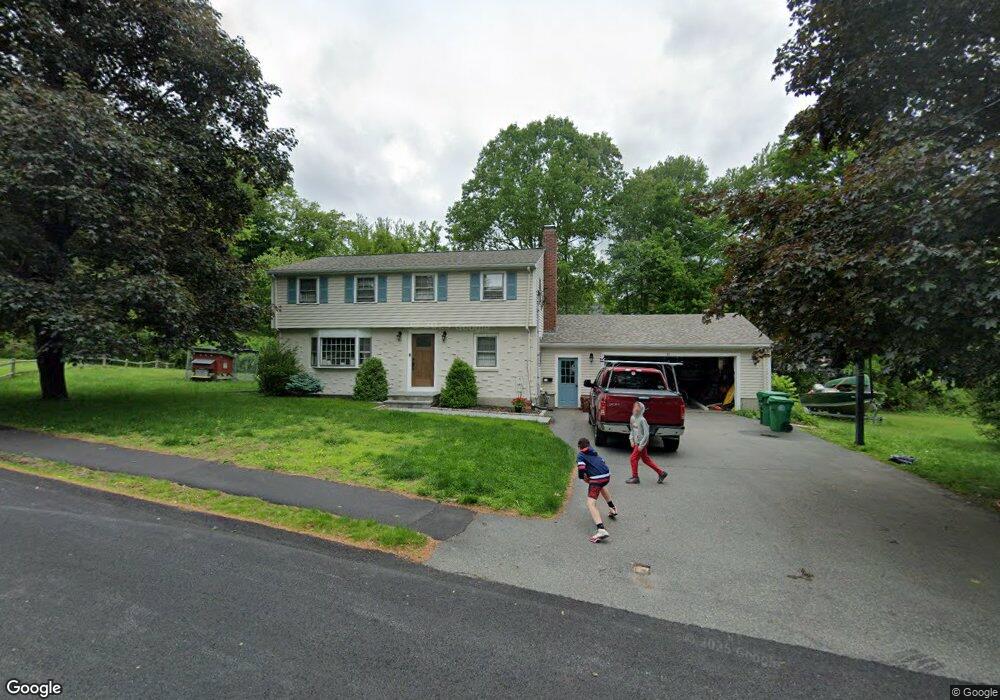
41 Marshall St Westwood, MA 02090
Estimated Value: $971,154 - $1,103,000
4
Beds
2
Baths
1,666
Sq Ft
$625/Sq Ft
Est. Value
About This Home
This home is located at 41 Marshall St, Westwood, MA 02090 and is currently estimated at $1,040,789, approximately $624 per square foot. 41 Marshall St is a home located in Norfolk County with nearby schools including Westwood High School, St Catherine Of Siena School, and Dedham Country Day School.
Ownership History
Date
Name
Owned For
Owner Type
Purchase Details
Closed on
Jul 9, 2015
Sold by
Buckley Ft
Bought by
Blaney Joshua M and Blaney Joanna M
Current Estimated Value
Home Financials for this Owner
Home Financials are based on the most recent Mortgage that was taken out on this home.
Original Mortgage
$416,643
Outstanding Balance
$324,987
Interest Rate
3.87%
Mortgage Type
New Conventional
Estimated Equity
$715,802
Purchase Details
Closed on
Dec 19, 2011
Sold by
Buckley Anna C
Bought by
Buckley Ft and Buckley Robert F
Create a Home Valuation Report for This Property
The Home Valuation Report is an in-depth analysis detailing your home's value as well as a comparison with similar homes in the area
Home Values in the Area
Average Home Value in this Area
Purchase History
| Date | Buyer | Sale Price | Title Company |
|---|---|---|---|
| Blaney Joshua M | $514,000 | -- | |
| Buckley Ft | -- | -- |
Source: Public Records
Mortgage History
| Date | Status | Borrower | Loan Amount |
|---|---|---|---|
| Open | Blaney Joshua M | $416,643 |
Source: Public Records
Tax History Compared to Growth
Tax History
| Year | Tax Paid | Tax Assessment Tax Assessment Total Assessment is a certain percentage of the fair market value that is determined by local assessors to be the total taxable value of land and additions on the property. | Land | Improvement |
|---|---|---|---|---|
| 2025 | $10,501 | $820,400 | $411,900 | $408,500 |
| 2024 | $10,306 | $804,500 | $392,500 | $412,000 |
| 2023 | $9,096 | $636,100 | $326,900 | $309,200 |
| 2022 | $8,637 | $582,400 | $289,150 | $293,250 |
| 2021 | $8,620 | $583,250 | $275,300 | $307,950 |
| 2020 | $8,259 | $569,200 | $269,350 | $299,850 |
| 2019 | $7,891 | $538,650 | $256,600 | $282,050 |
| 2018 | $7,757 | $514,050 | $256,600 | $257,450 |
| 2017 | $7,290 | $500,350 | $256,600 | $243,750 |
| 2016 | $7,138 | $486,900 | $256,600 | $230,300 |
| 2015 | -- | $451,700 | $256,600 | $195,100 |
Source: Public Records
Map
Nearby Homes
- 39 Westbrook Ln
- 50 Fairview St
- 298 Washington St Unit 302
- 130 Cobleigh St
- 102 Parker St
- 290 East St
- 102 Smith Dr
- 1 Laura Ln
- 17 Royal Ct
- 132 Thatcher St
- 365 Washington St Unit 5
- 1000 Washington St Unit 205
- 66 Crestwood Cir
- 401 Sandy Valley Rd
- 618 Nahatan St
- 470 Nahatan St
- 301 Neponset St Unit 17
- 19 Cushing Rd
- 227 Prospect St
- 355 Canton St
- 87 Brookfield Rd
- 33 Marshall St
- 83 Brookfield Rd
- 49 Marshall St
- 91 Brookfield Rd
- 44 Marshall St
- 930 Clapboardtree St
- 97 Brookfield Rd
- 50 Marshall St
- 79 Brookfield Rd
- 25 Marshall St
- 86 Brookfield Rd
- 26 Marshall St
- 98 Brookfield Rd
- 103 Brookfield Rd
- 73 Brookfield Rd
- 100 Brookfield Rd
- 64 Brookfield Rd
- 15 Marshall St
- 109 Brookfield Rd