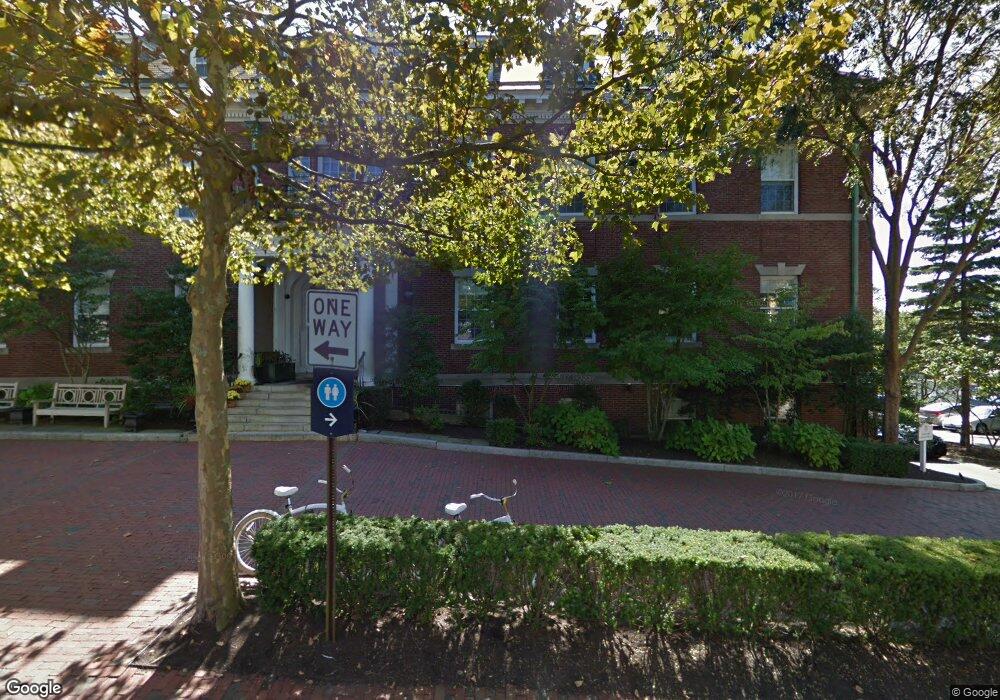
41 Mary St Newport, RI 02840
Historic Hill Neighborhood
--
Bed
--
Bath
35,095
Sq Ft
--
Built
About This Home
This home is located at 41 Mary St, Newport, RI 02840. 41 Mary St is a home located in Newport County with nearby schools including Rogers High School.
Ownership History
Date
Name
Owned For
Owner Type
Purchase Details
Closed on
Apr 11, 2025
Sold by
Vanderbilt Hotel Llc
Bought by
41 Mary Llc
Home Financials for this Owner
Home Financials are based on the most recent Mortgage that was taken out on this home.
Original Mortgage
$10,500,000
Outstanding Balance
$10,435,764
Interest Rate
6.76%
Mortgage Type
Purchase Money Mortgage
Purchase Details
Closed on
Dec 3, 2010
Sold by
Hldng Vanderbilt Hall
Bought by
Grace Hotels Vanderbil
Purchase Details
Closed on
Nov 17, 2009
Sold by
Vanderbilt Hall Lp
Bought by
Vanderbilt Hall Hold L
Create a Home Valuation Report for This Property
The Home Valuation Report is an in-depth analysis detailing your home's value as well as a comparison with similar homes in the area
Home Values in the Area
Average Home Value in this Area
Purchase History
| Date | Buyer | Sale Price | Title Company |
|---|---|---|---|
| 41 Mary Llc | $15,000,000 | None Available | |
| 41 Mary Llc | $15,000,000 | None Available | |
| Grace Hotels Vanderbil | $7,400,000 | -- | |
| Grace Hotels Vanderbil | $7,400,000 | -- | |
| Vanderbilt Hall Hold L | $5,700,000 | -- | |
| Vanderbilt Hall Hold L | $5,700,000 | -- |
Source: Public Records
Mortgage History
| Date | Status | Borrower | Loan Amount |
|---|---|---|---|
| Open | 41 Mary Llc | $10,500,000 | |
| Closed | 41 Mary Llc | $10,500,000 |
Source: Public Records
Tax History Compared to Growth
Tax History
| Year | Tax Paid | Tax Assessment Tax Assessment Total Assessment is a certain percentage of the fair market value that is determined by local assessors to be the total taxable value of land and additions on the property. | Land | Improvement |
|---|---|---|---|---|
| 2025 | $101,575 | $9,431,300 | $2,943,000 | $6,488,300 |
| 2024 | $110,668 | $10,580,100 | $2,943,000 | $7,637,100 |
| 2023 | $153,248 | $10,298,900 | $2,632,000 | $7,666,900 |
| 2022 | $137,503 | $9,542,200 | $2,632,000 | $6,910,200 |
| 2021 | $144,082 | $10,298,900 | $2,632,000 | $7,666,900 |
| 2020 | $171,520 | $11,123,200 | $2,215,300 | $8,907,900 |
| 2019 | $171,520 | $11,123,200 | $2,215,300 | $8,907,900 |
| 2018 | $166,626 | $11,123,200 | $2,215,300 | $8,907,900 |
| 2017 | $172,905 | $11,119,300 | $1,629,900 | $9,489,400 |
| 2016 | $168,569 | $11,119,300 | $1,629,900 | $9,489,400 |
| 2015 | $164,454 | $11,119,300 | $1,629,900 | $9,489,400 |
| 2014 | $121,130 | $7,244,600 | $1,629,900 | $5,614,700 |
Source: Public Records
Map
Nearby Homes
- 130 Spring St Unit 132
- 50 School St Unit 7
- 10 Barney St Unit 102
- 10 Barney St Unit 107
- 10 Barney St Unit 101
- 10 Barney St Unit U106
- 12 Mount Vernon St Unit 5
- 75 Pelham St Unit B
- 26 Franklin St
- 60 Prospect Hill St
- 10 Bull St
- 34 Bull St
- 31 Coddington St Unit 24
- 27 Soar Way
- 102 Broadway Unit 2B
- 33 Kay St
- 23 Mann Ave Unit 4
- 30 Brewer St Unit 3
- 8 Cottage St Unit 2
- 1 Pell St
- 109 Spring St Unit 111
- 113 Spring St Unit 115
- 119 Spring St
- 26 Mary St
- 46 Clarke St
- 113-115 Spring St
- 29 Mary St
- 123 Spring St
- 129 Spring St
- 36 Church St
- 44 Clarke St
- 39 Clarke St
- 46 Church St
- 118 Spring St
- 120 Spring St
- 108 Spring St
- 99 Spring St Unit T1
- 99 Spring St Unit R2
- 99 Spring St Unit R1
- 99 Spring St Unit TH1