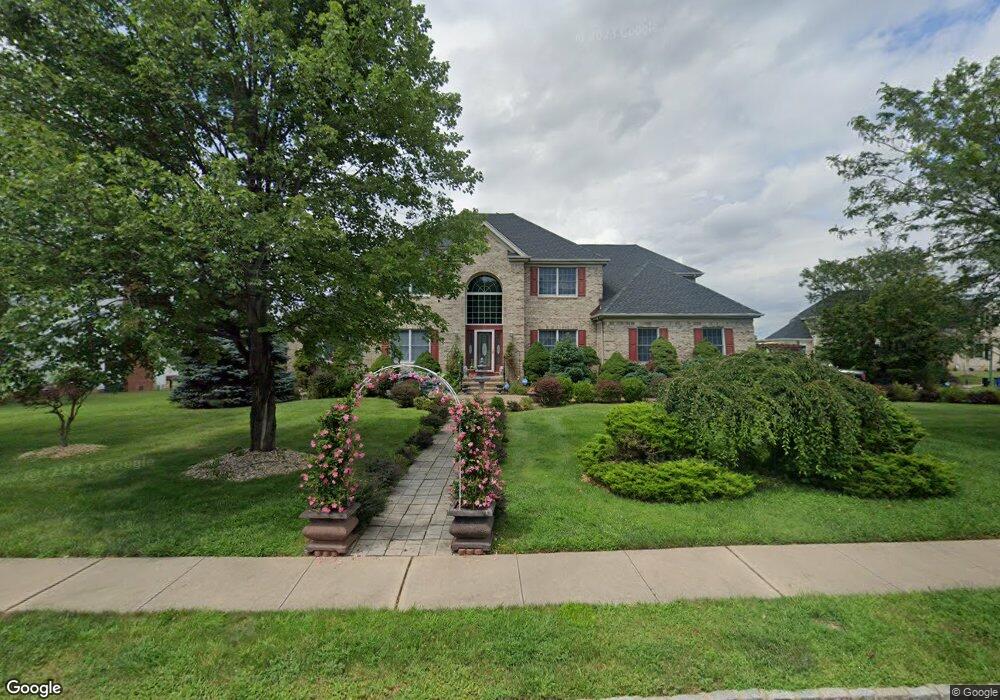
41 Matrick Ct Hillsborough, NJ 08844
Estimated Value: $1,163,000 - $1,231,658
--
Bed
--
Bath
3,532
Sq Ft
$342/Sq Ft
Est. Value
About This Home
This home is located at 41 Matrick Ct, Hillsborough, NJ 08844 and is currently estimated at $1,207,665, approximately $341 per square foot. 41 Matrick Ct is a home located in Somerset County with nearby schools including Hillsborough High School and Central Jersey College Prep Charter School.
Ownership History
Date
Name
Owned For
Owner Type
Purchase Details
Closed on
Jul 22, 2003
Sold by
Saxena Yogesh R
Bought by
Patel Jatin B and Patel Chandrika J
Current Estimated Value
Home Financials for this Owner
Home Financials are based on the most recent Mortgage that was taken out on this home.
Original Mortgage
$440,000
Interest Rate
6.22%
Purchase Details
Closed on
Nov 9, 1999
Sold by
Country Classics
Bought by
Saxena Yogesh
Home Financials for this Owner
Home Financials are based on the most recent Mortgage that was taken out on this home.
Original Mortgage
$351,450
Interest Rate
7.76%
Create a Home Valuation Report for This Property
The Home Valuation Report is an in-depth analysis detailing your home's value as well as a comparison with similar homes in the area
Home Values in the Area
Average Home Value in this Area
Purchase History
| Date | Buyer | Sale Price | Title Company |
|---|---|---|---|
| Patel Jatin B | $610,000 | -- | |
| Saxena Yogesh | $439,355 | -- |
Source: Public Records
Mortgage History
| Date | Status | Borrower | Loan Amount |
|---|---|---|---|
| Previous Owner | Patel Jatin B | $440,000 | |
| Previous Owner | Saxena Yogesh | $351,450 |
Source: Public Records
Tax History Compared to Growth
Tax History
| Year | Tax Paid | Tax Assessment Tax Assessment Total Assessment is a certain percentage of the fair market value that is determined by local assessors to be the total taxable value of land and additions on the property. | Land | Improvement |
|---|---|---|---|---|
| 2025 | $19,889 | $1,009,900 | $436,900 | $573,000 |
| 2024 | $19,889 | $928,100 | $401,900 | $526,200 |
| 2023 | $18,090 | $840,200 | $361,900 | $478,300 |
| 2022 | $17,927 | $802,800 | $321,900 | $480,900 |
| 2021 | $17,105 | $728,500 | $271,900 | $456,600 |
| 2020 | $16,831 | $706,000 | $246,900 | $459,100 |
| 2019 | $16,792 | $698,500 | $236,900 | $461,600 |
| 2018 | $16,473 | $681,000 | $216,900 | $464,100 |
| 2017 | $16,395 | $678,900 | $213,800 | $465,100 |
| 2016 | $16,451 | $681,500 | $213,800 | $467,700 |
| 2015 | $16,240 | $681,200 | $208,800 | $472,400 |
| 2014 | $14,861 | $636,700 | $208,800 | $427,900 |
Source: Public Records
Map
Nearby Homes