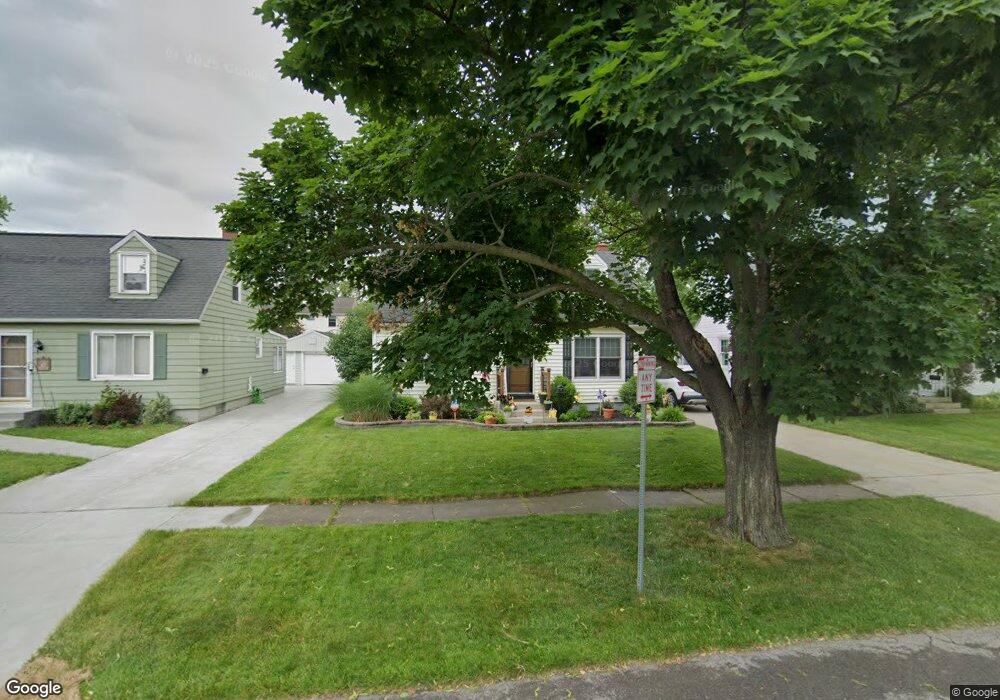
41 Milsom Ave Buffalo, NY 14227
South Cheektowaga NeighborhoodEstimated Value: $198,000 - $220,922
4
Beds
1
Bath
1,089
Sq Ft
$194/Sq Ft
Est. Value
About This Home
This home is located at 41 Milsom Ave, Buffalo, NY 14227 and is currently estimated at $210,981, approximately $193 per square foot. 41 Milsom Ave is a home located in Erie County with nearby schools including Theodore Roosevelt School, Woodrow Wilson Elementary School, and John F Kennedy Middle School.
Ownership History
Date
Name
Owned For
Owner Type
Purchase Details
Closed on
May 24, 1999
Sold by
Jeanette M Strozewski F and Jeanette K
Bought by
Walczak Donna M
Current Estimated Value
Home Financials for this Owner
Home Financials are based on the most recent Mortgage that was taken out on this home.
Original Mortgage
$65,970
Outstanding Balance
$16,820
Interest Rate
6.88%
Mortgage Type
FHA
Estimated Equity
$194,161
Create a Home Valuation Report for This Property
The Home Valuation Report is an in-depth analysis detailing your home's value as well as a comparison with similar homes in the area
Home Values in the Area
Average Home Value in this Area
Purchase History
| Date | Buyer | Sale Price | Title Company |
|---|---|---|---|
| Walczak Donna M | $64,600 | -- | |
| Fern Jeanette M | $22,667 | -- |
Source: Public Records
Mortgage History
| Date | Status | Borrower | Loan Amount |
|---|---|---|---|
| Open | Fern Jeanette M | $65,970 |
Source: Public Records
Tax History
| Year | Tax Paid | Tax Assessment Tax Assessment Total Assessment is a certain percentage of the fair market value that is determined by local assessors to be the total taxable value of land and additions on the property. | Land | Improvement |
|---|---|---|---|---|
| 2024 | $5,911 | $158,000 | $11,000 | $147,000 |
| 2023 | $5,660 | $158,000 | $11,000 | $147,000 |
| 2022 | $5,567 | $158,000 | $11,000 | $147,000 |
| 2021 | $5,499 | $137,000 | $11,000 | $126,000 |
| 2020 | $3,464 | $72,300 | $8,900 | $63,400 |
| 2019 | $3,173 | $72,300 | $8,900 | $63,400 |
| 2018 | $3,231 | $72,300 | $8,900 | $63,400 |
| 2017 | $1,806 | $72,300 | $8,900 | $63,400 |
| 2016 | $3,152 | $72,300 | $8,900 | $63,400 |
| 2015 | -- | $72,300 | $8,900 | $63,400 |
| 2014 | -- | $72,300 | $8,900 | $63,400 |
Source: Public Records
Map
Nearby Homes
- 83 Patricia Ln
- 104 Starlite Ave
- 104 Iroquois Ave
- 2445 William St
- 27 Edmund St
- 79 Raymond Ave
- 192 Cass Ave
- 255 Crisfield Ave
- 156 Cass Ave
- 428 Kennedy Rd
- 16 Wallace Ave
- 27 Lemoine Ave
- 2247 William St
- 45 Wallace Ave
- 49 Mann St
- 110 Hedley St
- 30 Jane Dr
- 12 Brookfield Ln Unit 6
- 60 Constance Ln
- 134 Colby St
Your Personal Tour Guide
Ask me questions while you tour the home.