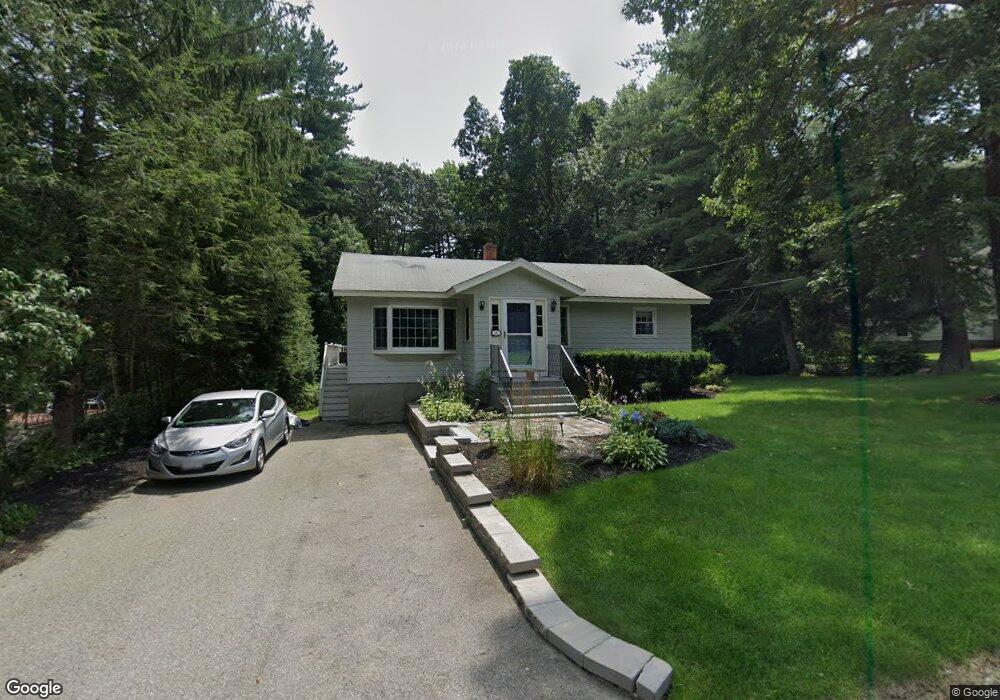
41 Mohawk Dr Northborough, MA 01532
Estimated Value: $578,266 - $627,000
4
Beds
2
Baths
1,328
Sq Ft
$459/Sq Ft
Est. Value
About This Home
This home is located at 41 Mohawk Dr, Northborough, MA 01532 and is currently estimated at $609,817, approximately $459 per square foot. 41 Mohawk Dr is a home located in Worcester County with nearby schools including Marion E. Zeh Elementary School, Robert E. Melican Middle School, and Algonquin Regional High School.
Ownership History
Date
Name
Owned For
Owner Type
Purchase Details
Closed on
Apr 26, 1996
Sold by
King Steven M and King Colleen
Bought by
Dellapenna David J and Dellapenna Kathleen
Current Estimated Value
Purchase Details
Closed on
Jun 1, 1992
Sold by
Curran George N
Bought by
King Steven M and King Colleen J
Create a Home Valuation Report for This Property
The Home Valuation Report is an in-depth analysis detailing your home's value as well as a comparison with similar homes in the area
Home Values in the Area
Average Home Value in this Area
Purchase History
| Date | Buyer | Sale Price | Title Company |
|---|---|---|---|
| Dellapenna David J | $144,500 | -- | |
| King Steven M | $142,000 | -- |
Source: Public Records
Mortgage History
| Date | Status | Borrower | Loan Amount |
|---|---|---|---|
| Open | King Steven M | $192,500 | |
| Closed | King Steven M | $38,600 | |
| Closed | King Steven M | $135,500 |
Source: Public Records
Tax History
| Year | Tax Paid | Tax Assessment Tax Assessment Total Assessment is a certain percentage of the fair market value that is determined by local assessors to be the total taxable value of land and additions on the property. | Land | Improvement |
|---|---|---|---|---|
| 2025 | $7,798 | $547,200 | $278,300 | $268,900 |
| 2024 | $6,723 | $470,800 | $230,400 | $240,400 |
| 2023 | $6,530 | $441,500 | $217,600 | $223,900 |
| 2022 | $6,413 | $388,900 | $207,200 | $181,700 |
| 2021 | $6,158 | $359,700 | $188,400 | $171,300 |
| 2020 | $6,212 | $360,100 | $188,400 | $171,700 |
| 2019 | $5,906 | $344,400 | $182,800 | $161,600 |
| 2018 | $5,586 | $321,200 | $177,700 | $143,500 |
| 2017 | $5,417 | $311,500 | $177,700 | $133,800 |
| 2016 | $5,244 | $305,400 | $174,100 | $131,300 |
| 2015 | $4,989 | $298,200 | $179,200 | $119,000 |
| 2014 | $4,703 | $283,500 | $179,200 | $104,300 |
Source: Public Records
Map
Nearby Homes
- 245 Brewer St
- 10 Sawyer Rd
- 202 Brewer St
- 429 Howard St
- 460 Whitney St
- 26 Treetop Cir
- 1A Mentzer Ave
- 122 Green St
- 243 Church St
- 13 Dennis Cir
- 210 Green St
- 39 Pleasant St Unit A6
- 39 Pleasant St Unit C5
- 39 Pleasant St Unit A17
- 39 Pleasant St Unit B10
- 39 Pleasant St Unit B4
- 6 Silas Dr
- 125 Rice Ave
- 85 Hudson St Unit 85
- 6 Lydias Way Unit 6
Your Personal Tour Guide
Ask me questions while you tour the home.