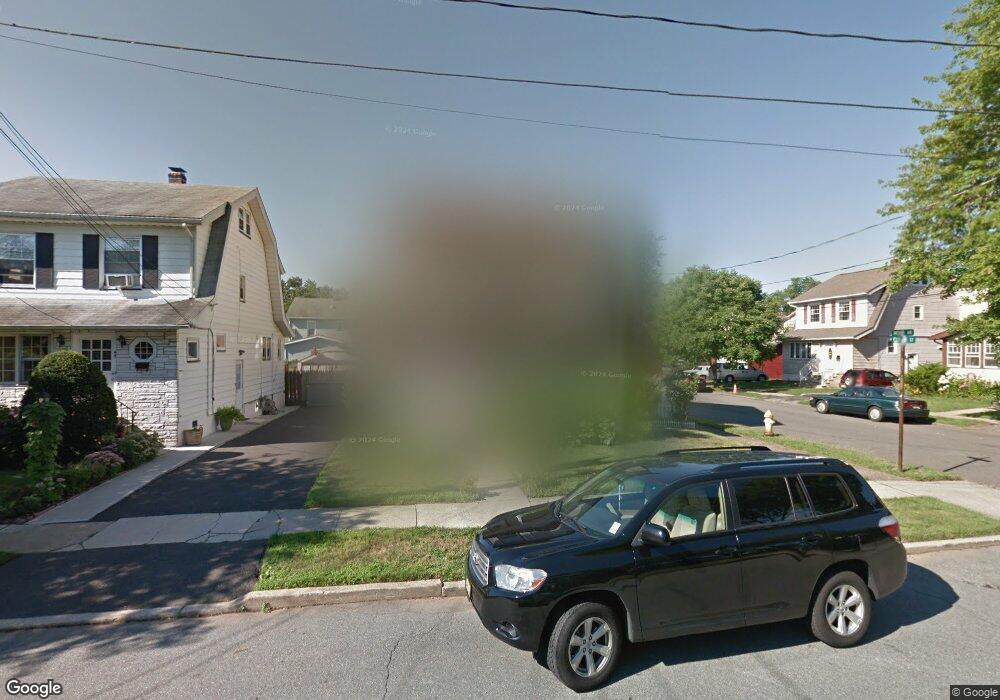
41 Mohr Ave Bloomfield, NJ 07003
Estimated Value: $571,000 - $677,000
--
Bed
--
Bath
1,552
Sq Ft
$407/Sq Ft
Est. Value
About This Home
This home is located at 41 Mohr Ave, Bloomfield, NJ 07003 and is currently estimated at $631,619, approximately $406 per square foot. 41 Mohr Ave is a home located in Essex County with nearby schools including Demarest School, Bloomfield Middle School, and Bloomfield High School.
Ownership History
Date
Name
Owned For
Owner Type
Purchase Details
Closed on
Jan 25, 2011
Sold by
Martinez Kim and Martinez John
Bought by
Mcswain Maria
Current Estimated Value
Home Financials for this Owner
Home Financials are based on the most recent Mortgage that was taken out on this home.
Original Mortgage
$241,713
Outstanding Balance
$166,104
Interest Rate
4.87%
Mortgage Type
FHA
Estimated Equity
$465,515
Purchase Details
Closed on
Jan 2, 1990
Sold by
Hamilton Robert P
Bought by
Toppeto Carmen and Mary Doris
Create a Home Valuation Report for This Property
The Home Valuation Report is an in-depth analysis detailing your home's value as well as a comparison with similar homes in the area
Home Values in the Area
Average Home Value in this Area
Purchase History
| Date | Buyer | Sale Price | Title Company |
|---|---|---|---|
| Mcswain Maria | $248,000 | Fidelity Natl Title Ins Co | |
| Toppeto Carmen | $152,500 | -- |
Source: Public Records
Mortgage History
| Date | Status | Borrower | Loan Amount |
|---|---|---|---|
| Open | Mcswain Maria | $241,713 |
Source: Public Records
Tax History Compared to Growth
Tax History
| Year | Tax Paid | Tax Assessment Tax Assessment Total Assessment is a certain percentage of the fair market value that is determined by local assessors to be the total taxable value of land and additions on the property. | Land | Improvement |
|---|---|---|---|---|
| 2025 | $12,931 | $395,700 | $155,400 | $240,300 |
| 2024 | $12,931 | $395,700 | $155,400 | $240,300 |
| 2022 | $12,670 | $395,700 | $155,400 | $240,300 |
| 2021 | $12,437 | $395,700 | $155,400 | $240,300 |
| 2020 | $12,247 | $395,700 | $155,400 | $240,300 |
| 2019 | $11,808 | $296,600 | $139,000 | $157,600 |
| 2018 | $11,757 | $296,600 | $139,000 | $157,600 |
| 2017 | $11,579 | $296,600 | $139,000 | $157,600 |
| 2016 | $11,449 | $296,600 | $139,000 | $157,600 |
| 2015 | $11,345 | $296,600 | $139,000 | $157,600 |
| 2014 | $11,137 | $296,600 | $139,000 | $157,600 |
Source: Public Records
Map
Nearby Homes