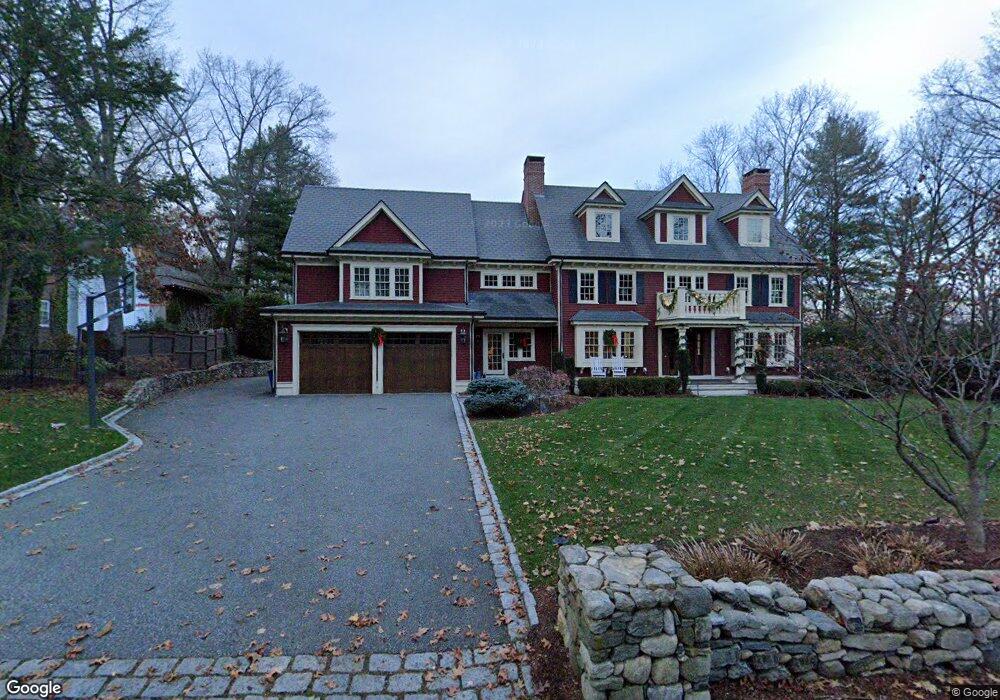
41 Myopia Rd Unit 1 Winchester, MA 01890
Estimated Value: $2,403,000 - $3,523,000
4
Beds
4
Baths
3,043
Sq Ft
$1,037/Sq Ft
Est. Value
About This Home
This home is located at 41 Myopia Rd Unit 1, Winchester, MA 01890 and is currently estimated at $3,157,036, approximately $1,037 per square foot. 41 Myopia Rd Unit 1 is a home located in Middlesex County with nearby schools including Ambrose Elementary School, McCall Middle School, and Winchester High School.
Ownership History
Date
Name
Owned For
Owner Type
Purchase Details
Closed on
Jun 26, 2012
Sold by
Lindner 3Rd Charles H and Lindner Julia P
Bought by
41 Myopia T
Current Estimated Value
Home Financials for this Owner
Home Financials are based on the most recent Mortgage that was taken out on this home.
Original Mortgage
$999,900
Outstanding Balance
$695,746
Interest Rate
3.84%
Mortgage Type
Purchase Money Mortgage
Estimated Equity
$2,461,290
Purchase Details
Closed on
Jul 2, 2009
Sold by
Arian Nabil E and Arian Mary J
Bought by
Lindner Charles H and Lindner Julia P
Home Financials for this Owner
Home Financials are based on the most recent Mortgage that was taken out on this home.
Original Mortgage
$839,300
Interest Rate
4.86%
Mortgage Type
Purchase Money Mortgage
Purchase Details
Closed on
Apr 29, 2004
Sold by
Arian Mary J
Bought by
Arian Mary J and Arian Nabil E
Create a Home Valuation Report for This Property
The Home Valuation Report is an in-depth analysis detailing your home's value as well as a comparison with similar homes in the area
Purchase History
| Date | Buyer | Sale Price | Title Company |
|---|---|---|---|
| 41 Myopia T | $1,315,000 | -- | |
| Lindner Charles H | $1,199,000 | -- | |
| Arian Mary J | -- | -- |
Source: Public Records
Mortgage History
| Date | Status | Borrower | Loan Amount |
|---|---|---|---|
| Open | 41 Myopia T | $999,900 | |
| Previous Owner | Lindner Charles H | $839,300 |
Source: Public Records
Tax History Compared to Growth
Tax History
| Year | Tax Paid | Tax Assessment Tax Assessment Total Assessment is a certain percentage of the fair market value that is determined by local assessors to be the total taxable value of land and additions on the property. | Land | Improvement |
|---|---|---|---|---|
| 2025 | $370 | $3,334,600 | $1,320,200 | $2,014,400 |
| 2024 | $36,234 | $3,198,100 | $1,320,200 | $1,877,900 |
| 2023 | $36,025 | $3,053,000 | $1,240,200 | $1,812,800 |
| 2022 | $36,129 | $2,888,000 | $1,120,200 | $1,767,800 |
| 2021 | $10,605 | $2,748,000 | $980,200 | $1,767,800 |
| 2020 | $33,407 | $2,696,300 | $980,200 | $1,716,100 |
| 2019 | $31,562 | $2,606,300 | $890,200 | $1,716,100 |
| 2018 | $31,064 | $2,548,300 | $874,200 | $1,674,100 |
| 2017 | $30,521 | $2,485,400 | $874,200 | $1,611,200 |
| 2016 | $28,533 | $2,442,900 | $874,200 | $1,568,700 |
| 2015 | $28,065 | $2,311,800 | $794,200 | $1,517,600 |
| 2014 | $27,772 | $2,193,700 | $722,200 | $1,471,500 |
Source: Public Records
Map
Nearby Homes