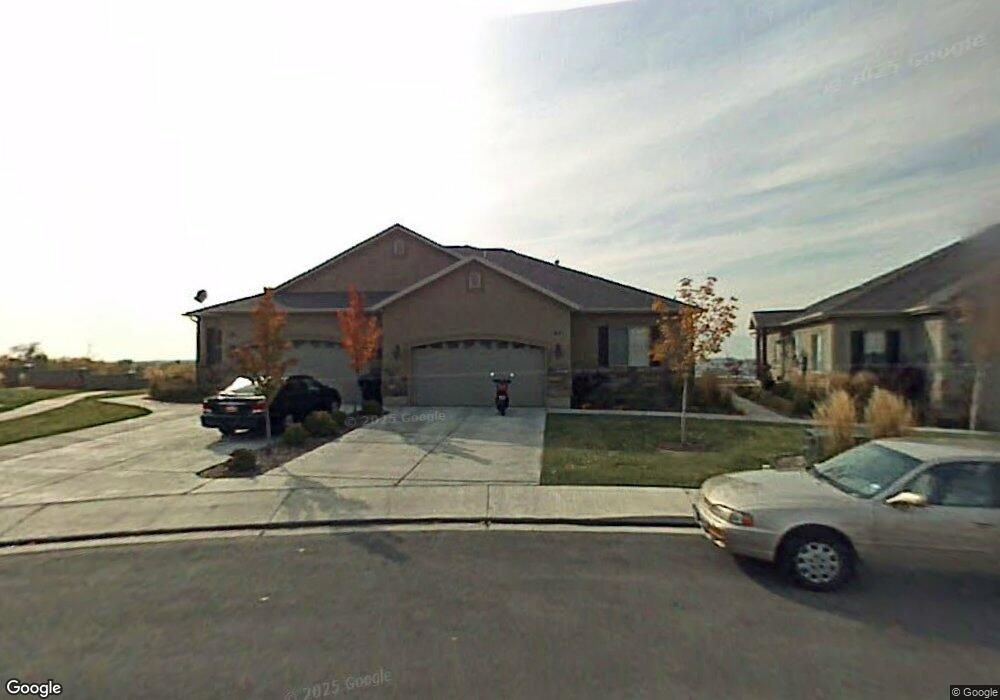
41 N 970 W Orem, UT 84057
Suncrest NeighborhoodEstimated Value: $493,000 - $626,363
5
Beds
3
Baths
3,640
Sq Ft
$154/Sq Ft
Est. Value
About This Home
This home is located at 41 N 970 W, Orem, UT 84057 and is currently estimated at $560,121, approximately $153 per square foot. 41 N 970 W is a home located in Utah County with nearby schools including Orem Junior High School, Mountain View High School, and Franklin Discovery Academy.
Ownership History
Date
Name
Owned For
Owner Type
Purchase Details
Closed on
May 22, 2025
Sold by
Christenson Don J and Christenson Karen L
Bought by
Don J And Karen L Christenson Revocable Livin and Christenson
Current Estimated Value
Purchase Details
Closed on
Nov 29, 2005
Sold by
Griffin Brent
Bought by
Christenson Don J and Christenson Karen L
Home Financials for this Owner
Home Financials are based on the most recent Mortgage that was taken out on this home.
Original Mortgage
$205,000
Interest Rate
6.07%
Mortgage Type
Fannie Mae Freddie Mac
Purchase Details
Closed on
May 6, 2005
Sold by
Glr Lc
Bought by
Griffin Brent
Home Financials for this Owner
Home Financials are based on the most recent Mortgage that was taken out on this home.
Original Mortgage
$170,000
Interest Rate
5.99%
Mortgage Type
Purchase Money Mortgage
Create a Home Valuation Report for This Property
The Home Valuation Report is an in-depth analysis detailing your home's value as well as a comparison with similar homes in the area
Home Values in the Area
Average Home Value in this Area
Purchase History
| Date | Buyer | Sale Price | Title Company |
|---|---|---|---|
| Don J And Karen L Christenson Revocable Livin | -- | None Listed On Document | |
| Christenson Don J | -- | Equity Title Orem Blvd | |
| Griffin Brent | -- | First American Title Agency |
Source: Public Records
Mortgage History
| Date | Status | Borrower | Loan Amount |
|---|---|---|---|
| Previous Owner | Christenson Don J | $205,000 | |
| Previous Owner | Griffin Brent | $170,000 |
Source: Public Records
Tax History
| Year | Tax Paid | Tax Assessment Tax Assessment Total Assessment is a certain percentage of the fair market value that is determined by local assessors to be the total taxable value of land and additions on the property. | Land | Improvement |
|---|---|---|---|---|
| 2025 | $2,607 | $340,010 | -- | -- |
| 2024 | $2,443 | $318,835 | $0 | $0 |
| 2023 | $418 | $321,035 | $0 | $0 |
| 2022 | $418 | $301,455 | $0 | $0 |
| 2021 | $2,153 | $415,200 | $90,000 | $325,200 |
| 2020 | $1,770 | $384,400 | $90,000 | $294,400 |
| 2019 | $1,770 | $348,800 | $90,000 | $258,800 |
| 2018 | $1,852 | $348,800 | $90,000 | $258,800 |
| 2017 | $1,830 | $184,635 | $0 | $0 |
| 2016 | $0 | $154,550 | $0 | $0 |
| 2015 | -- | $148,830 | $0 | $0 |
| 2014 | -- | $135,300 | $0 | $0 |
Source: Public Records
Map
Nearby Homes
Your Personal Tour Guide
Ask me questions while you tour the home.