41 N Martha St Lombard, IL 60148
North Lombard NeighborhoodEstimated Value: $337,000 - $369,520
3
Beds
2
Baths
1,106
Sq Ft
$325/Sq Ft
Est. Value
About This Home
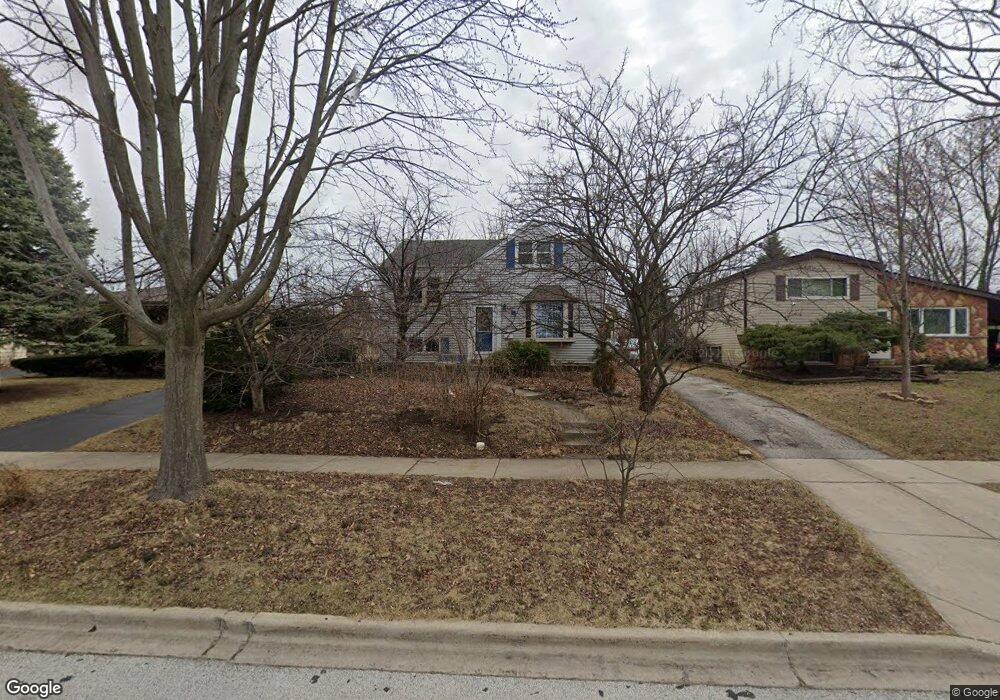
This home is located at 41 N Martha St, Lombard, IL 60148 and is currently estimated at $359,630, approximately $325 per square foot. 41 N Martha St is a home located in DuPage County with nearby schools including Pleasant Lane Elementary School, Park View Elementary School, and Madison Elementary School.
Ownership History
Date
Name
Owned For
Owner Type
Purchase Details
Closed on
Apr 14, 2001
Sold by
Dufort Christopher J
Bought by
Edmonson Christopher W
Current Estimated Value
Home Financials for this Owner
Home Financials are based on the most recent Mortgage that was taken out on this home.
Original Mortgage
$169,100
Interest Rate
6.95%
Purchase Details
Closed on
Sep 30, 1998
Sold by
Fry James E and Fry Lynn D
Bought by
Dufort Christopher J
Home Financials for this Owner
Home Financials are based on the most recent Mortgage that was taken out on this home.
Original Mortgage
$139,469
Interest Rate
6.9%
Mortgage Type
FHA
Purchase Details
Closed on
Jun 30, 1994
Sold by
Ferguson James H and Ferguson Linda J
Bought by
Fry James E and Zabolotzky Lynn D
Home Financials for this Owner
Home Financials are based on the most recent Mortgage that was taken out on this home.
Original Mortgage
$133,000
Interest Rate
8.66%
Create a Home Valuation Report for This Property
The Home Valuation Report is an in-depth analysis detailing your home's value as well as a comparison with similar homes in the area
Home Values in the Area
Average Home Value in this Area
Purchase History
| Date | Buyer | Sale Price | Title Company |
|---|---|---|---|
| Edmonson Christopher W | $178,000 | -- | |
| Dufort Christopher J | $142,000 | -- | |
| Fry James E | $140,000 | -- |
Source: Public Records
Mortgage History
| Date | Status | Borrower | Loan Amount |
|---|---|---|---|
| Closed | Edmonson Christopher W | $169,100 | |
| Previous Owner | Dufort Christopher J | $139,469 | |
| Previous Owner | Fry James E | $133,000 |
Source: Public Records
Tax History Compared to Growth
Tax History
| Year | Tax Paid | Tax Assessment Tax Assessment Total Assessment is a certain percentage of the fair market value that is determined by local assessors to be the total taxable value of land and additions on the property. | Land | Improvement |
|---|---|---|---|---|
| 2024 | $6,893 | $96,721 | $19,498 | $77,223 |
| 2023 | $6,549 | $89,440 | $18,030 | $71,410 |
| 2022 | $6,381 | $85,970 | $17,330 | $68,640 |
| 2021 | $6,179 | $83,830 | $16,900 | $66,930 |
| 2020 | $6,047 | $81,990 | $16,530 | $65,460 |
| 2019 | $5,741 | $77,960 | $15,720 | $62,240 |
| 2018 | $5,335 | $70,280 | $14,170 | $56,110 |
| 2017 | $6,124 | $78,100 | $17,550 | $60,550 |
| 2016 | $5,952 | $73,570 | $16,530 | $57,040 |
| 2015 | $5,618 | $68,540 | $15,400 | $53,140 |
| 2014 | $5,565 | $66,140 | $19,170 | $46,970 |
| 2013 | $5,481 | $67,070 | $19,440 | $47,630 |
Source: Public Records
Map
Nearby Homes
- 105 E Grove St
- 201 N Stewart Ave
- 220 N Martha St
- 33 N Main St Unit 11A
- 405 E Prairie Ave
- 107 S Charlotte St
- 252 N Lombard Ave
- 260 N Charlotte St
- 25 E Parkside Ave
- 49 Orchard Terrace Unit 1
- 373 N Lombard Ave
- 1 S Lincoln Ave Unit 301
- 313 S Lombard Ave
- 231 E Berkshire Ave
- 328 S Grace St
- 506 N Garfield St
- 78 N Elizabeth St
- 634 E Emerson Ave
- 82 S Lodge Ln
- 216 S Edgewood Ave
- 45 N Martha St
- 37 N Martha St
- 33 N Martha St
- 40 N Martha St
- 53 N Martha St
- 30 N Craig Place
- 38 N Craig Place
- 44 N Martha St
- 34 N Craig Place
- 36 N Martha St
- 22 N Craig Place
- 23 N Martha St
- 48 N Martha St
- 57 N Martha St
- 34 N Martha St
- 42 N Craig Place
- 18 N Craig Place
- 52 N Martha St
- 15 N Martha St
- 15 N Martha St Unit BS