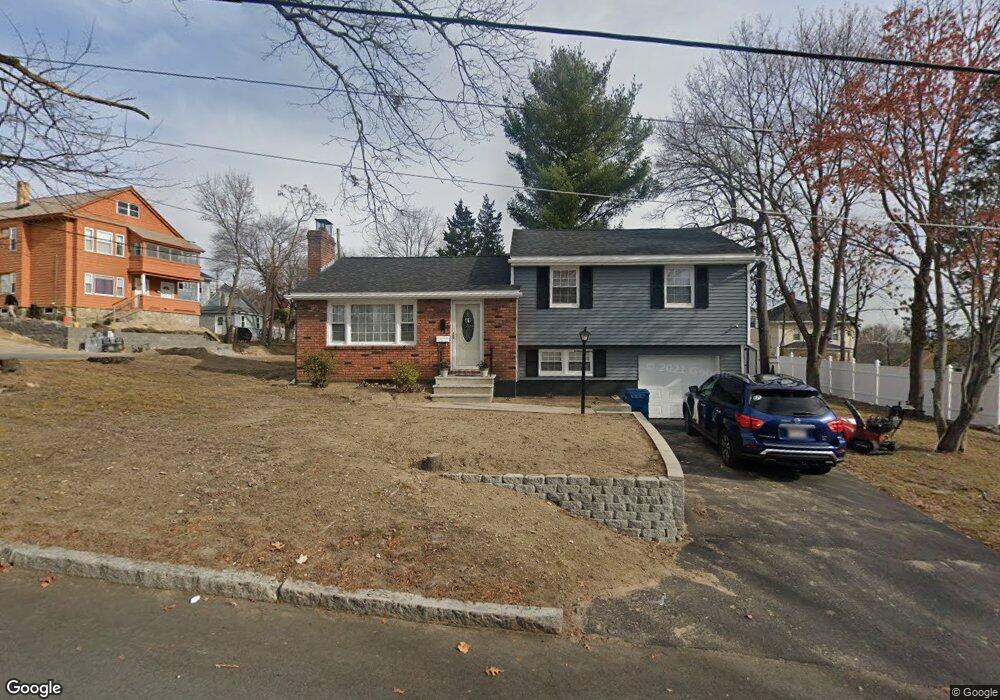
41 Nesmith St Lawrence, MA 01841
Tower Hill NeighborhoodEstimated Value: $454,000 - $521,799
3
Beds
2
Baths
1,040
Sq Ft
$470/Sq Ft
Est. Value
About This Home
This home is located at 41 Nesmith St, Lawrence, MA 01841 and is currently estimated at $488,450, approximately $469 per square foot. 41 Nesmith St is a home located in Essex County with nearby schools including Olive Branch Elementary School, Gerard A. Guilmette School, and School For Exceptional Studies.
Ownership History
Date
Name
Owned For
Owner Type
Purchase Details
Closed on
Dec 26, 2006
Sold by
Donovan Dorothea Ann
Bought by
Nichols Gleason and Nichols Dixie Ann
Current Estimated Value
Home Financials for this Owner
Home Financials are based on the most recent Mortgage that was taken out on this home.
Original Mortgage
$184,723
Outstanding Balance
$111,247
Interest Rate
6.35%
Mortgage Type
Purchase Money Mortgage
Estimated Equity
$377,203
Create a Home Valuation Report for This Property
The Home Valuation Report is an in-depth analysis detailing your home's value as well as a comparison with similar homes in the area
Home Values in the Area
Average Home Value in this Area
Purchase History
| Date | Buyer | Sale Price | Title Company |
|---|---|---|---|
| Nichols Gleason | $239,900 | -- |
Source: Public Records
Mortgage History
| Date | Status | Borrower | Loan Amount |
|---|---|---|---|
| Open | Nichols Gleason | $184,723 | |
| Closed | Nichols Gleason | $47,980 |
Source: Public Records
Tax History Compared to Growth
Tax History
| Year | Tax Paid | Tax Assessment Tax Assessment Total Assessment is a certain percentage of the fair market value that is determined by local assessors to be the total taxable value of land and additions on the property. | Land | Improvement |
|---|---|---|---|---|
| 2025 | $4,514 | $512,900 | $153,300 | $359,600 |
| 2024 | $4,150 | $448,700 | $148,300 | $300,400 |
| 2023 | $4,104 | $403,900 | $129,800 | $274,100 |
| 2022 | $4,041 | $353,200 | $120,700 | $232,500 |
| 2021 | $3,764 | $306,800 | $120,700 | $186,100 |
| 2020 | $3,585 | $288,400 | $102,300 | $186,100 |
| 2019 | $3,509 | $256,500 | $88,500 | $168,000 |
| 2018 | $3,324 | $232,100 | $84,600 | $147,500 |
| 2017 | $3,194 | $208,200 | $81,600 | $126,600 |
| 2016 | $3,040 | $196,000 | $58,100 | $137,900 |
| 2015 | $2,964 | $196,000 | $58,100 | $137,900 |
Source: Public Records
Map
Nearby Homes
- 439-443 Riverside Dr
- 450 Riverside Dr Unit 1
- 18 Ames St
- 1008 Essex St Unit 1010
- 30-32 Linden St
- 265 Ames St
- 95 Hancock St
- 312 Water St Unit 36
- 45 Bodwell St
- 68 Middlebury St
- 70 Butler St
- 12 Merrimack View Ct
- 55-59 Water St
- 62-66 Butler St
- 44-46 Butler St
- 37 Tewksbury St Unit 39
- 14-16 Cypress Ave
- 57 Strathmore Rd
- 88-90 Columbus Ave
- 2 Maurice Ave
- 35 Nesmith St
- 6 Hobson St Unit 6A
- 6 Hobson St
- 4 Hobson St Unit a
- 4 Hobson St Unit 4A
- 7-9 Dewey St
- 79 Dewey St
- 51 Nesmith St
- 2 Hobson St
- 10-12 Hobson St
- 10 Hobson St Unit 12
- 34 Nesmith St
- 42 Nesmith St
- 42A Nesmith St
- 64 Oregon Ave
- 14-16 Hobson St
- 31 Nesmith St
- 14 Hobson St Unit 16
- 7 Hobson St
- 55 Nesmith St