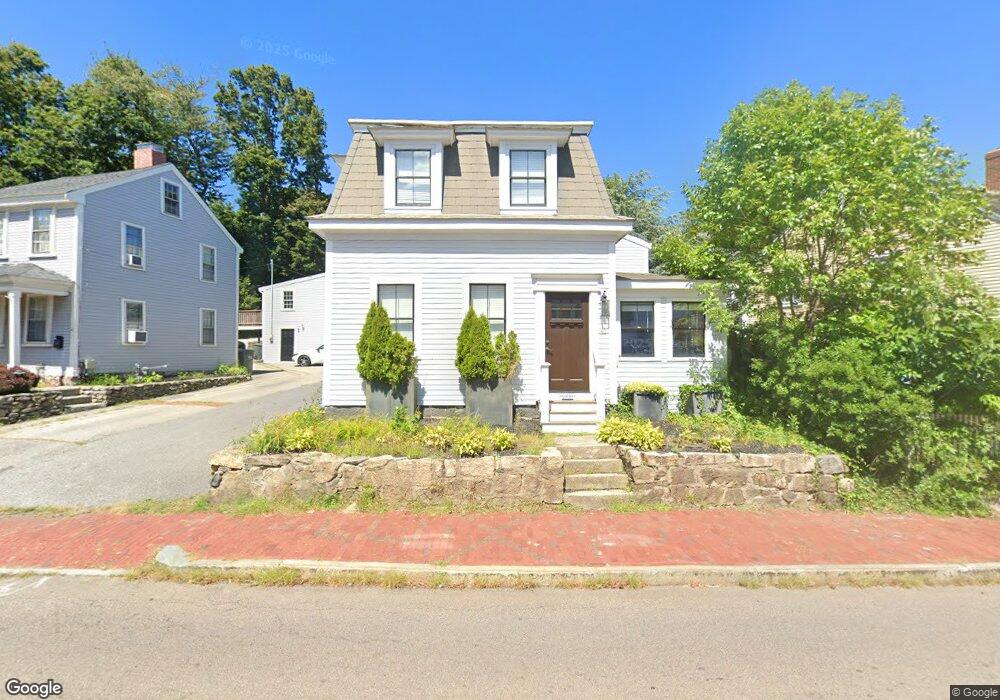
41 North St Unit n/a Hingham, MA 02043
Crow Point NeighborhoodEstimated Value: $867,888 - $1,464,000
3
Beds
2
Baths
1,690
Sq Ft
$618/Sq Ft
Est. Value
About This Home
This home is located at 41 North St Unit n/a, Hingham, MA 02043 and is currently estimated at $1,043,722, approximately $617 per square foot. 41 North St Unit n/a is a home located in Plymouth County with nearby schools including William L. Foster Elementary School, Hingham Middle School, and Hingham High School.
Ownership History
Date
Name
Owned For
Owner Type
Purchase Details
Closed on
Jul 17, 2025
Sold by
Sobran Eric C and Sobran Roberta M
Bought by
Sobran Eric C
Current Estimated Value
Purchase Details
Closed on
Jan 11, 2008
Sold by
Barrett John E
Bought by
Sobran Eric C and Sobran Roberta M
Home Financials for this Owner
Home Financials are based on the most recent Mortgage that was taken out on this home.
Original Mortgage
$157,500
Interest Rate
6.21%
Mortgage Type
Purchase Money Mortgage
Create a Home Valuation Report for This Property
The Home Valuation Report is an in-depth analysis detailing your home's value as well as a comparison with similar homes in the area
Home Values in the Area
Average Home Value in this Area
Purchase History
| Date | Buyer | Sale Price | Title Company |
|---|---|---|---|
| Sobran Eric C | -- | -- | |
| Sobran Eric C | -- | -- | |
| Sobran Eric C | $210,000 | -- | |
| Sobran Eric C | $210,000 | -- |
Source: Public Records
Mortgage History
| Date | Status | Borrower | Loan Amount |
|---|---|---|---|
| Previous Owner | Sobran Eric C | $157,500 |
Source: Public Records
Tax History
| Year | Tax Paid | Tax Assessment Tax Assessment Total Assessment is a certain percentage of the fair market value that is determined by local assessors to be the total taxable value of land and additions on the property. | Land | Improvement |
|---|---|---|---|---|
| 2025 | $7,100 | $664,200 | $348,000 | $316,200 |
| 2024 | $7,096 | $654,000 | $348,000 | $306,000 |
| 2023 | $6,413 | $641,300 | $348,000 | $293,300 |
| 2022 | $5,923 | $512,400 | $268,600 | $243,800 |
| 2021 | $7,504 | $502,500 | $268,600 | $233,900 |
| 2020 | $5,794 | $502,500 | $268,600 | $233,900 |
| 2019 | $3,526 | $498,300 | $268,600 | $229,700 |
| 2018 | $264 | $491,200 | $268,600 | $222,600 |
| 2017 | $271 | $449,700 | $248,300 | $201,400 |
| 2016 | $5,469 | $437,900 | $236,500 | $201,400 |
| 2015 | $5,347 | $426,700 | $225,300 | $201,400 |
Source: Public Records
Map
Nearby Homes
- 41 North St
- 41 North St Unit HOUSE
- 35 North St
- 45 North St
- 45 North St Unit 45
- 47 North St Unit Left
- 49 North St Unit Right
- 47 North St Unit right
- 49 North St Unit Left
- 49 North St
- 47 North St
- 38 North St Unit A
- 38 North St Unit B
- 38 North St Unit D
- 38 North St Unit 2nd
- 38 North St
- 38 North St Unit Apartment
- 38 North St Unit 2
- 24 Station St
- 31 North St
Your Personal Tour Guide
Ask me questions while you tour the home.