41 Oneida Ave Brockton, MA 02301
Estimated Value: $367,000 - $430,000
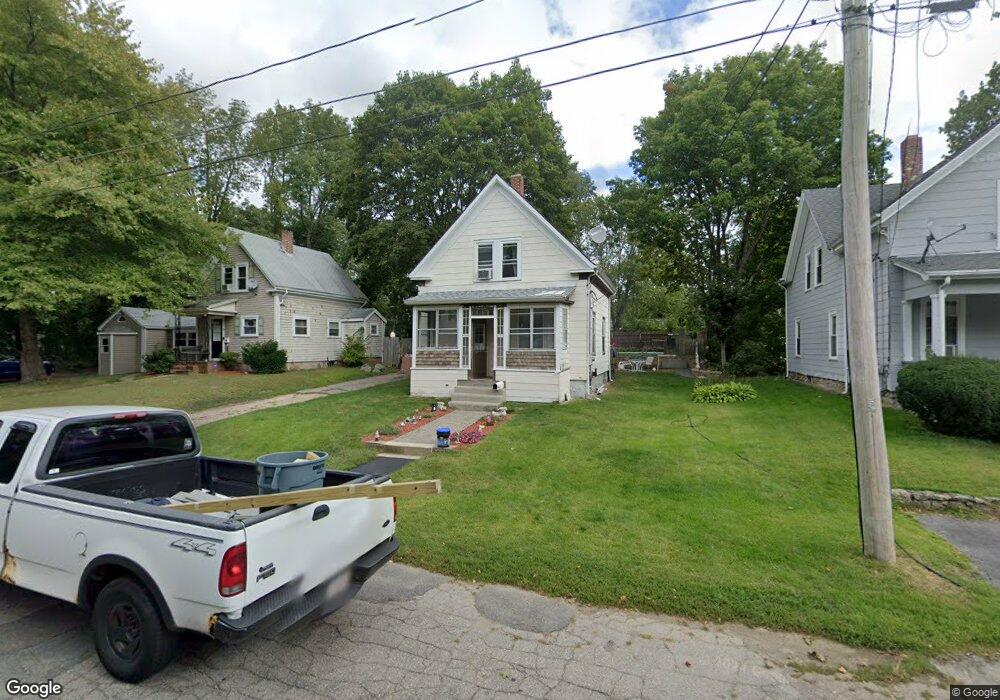
About This Home
This home is located at 41 Oneida Ave, Brockton, MA 02301 and is currently estimated at $386,169, approximately $597 per square foot. 41 Oneida Ave is a home located in Plymouth County with nearby schools including Manthala George Jr. School, Louis F Angelo Elementary School, and Hancock Elementary School.
Ownership History
We collect this data history from publicly available records. To have your information removed, we recommend requesting removal directly through your county’s website.
Purchase Details
Home Financials for this Owner
Home Financials are based on the most recent Mortgage that was taken out on this home.Purchase Details
Home Financials for this Owner
Home Financials are based on the most recent Mortgage that was taken out on this home.Purchase History
We collect this data history from publicly available records. To have your information removed, we recommend requesting removal directly through your county’s website.
| Date | Buyer | Sale Price | Title Company |
|---|---|---|---|
| -- | None Available | ||
| -- | None Available |
Mortgage History
We collect this data history from publicly available records. To have your information removed, we recommend requesting removal directly through your county’s website.
| Date | Status | Borrower | Loan Amount |
|---|---|---|---|
| Open | $50,000 |
Tax History
We collect this data history from publicly available records. To have your information removed, we recommend requesting removal directly through your county’s website.
| Year | Tax Paid | Tax Assessment Tax Assessment Total Assessment is a certain percentage of the fair market value that is determined by local assessors to be the total taxable value of land and additions on the property. | Land | Improvement |
|---|---|---|---|---|
| 2025 | $4,174 | $344,700 | $143,900 | $200,800 |
| 2024 | $4,088 | $340,100 | $143,900 | $196,200 |
| 2023 | $3,854 | $296,900 | $108,600 | $188,300 |
| 2022 | $3,498 | $250,400 | $98,600 | $151,800 |
| 2021 | $3,570 | $246,200 | $90,900 | $155,300 |
| 2020 | $3,584 | $236,600 | $87,400 | $149,200 |
| 2019 | $3,566 | $229,500 | $80,700 | $148,800 |
| 2018 | $3,305 | $205,800 | $80,700 | $125,100 |
| 2017 | $2,954 | $183,500 | $80,700 | $102,800 |
| 2016 | $2,715 | $156,400 | $73,000 | $83,400 |
| 2015 | $2,240 | $123,400 | $73,000 | $50,400 |
| 2014 | $2,435 | $134,300 | $73,000 | $61,300 |
Map
- 11 Montauk Rd
- 75 Colonel Bell Dr Unit 77-11
- 53 Colonel Bell Dr
- 77 Colonel Bell Dr Unit 4
- 81 Colonel Bell Dr Unit 9
- 16 Palmer St
- 17 West St
- 65 Cross Ave
- 46 Ash St
- 108 West St
- 40 Sycamore St
- 17 Park Rd
- 12 N Doris Ave
- 24 Fern Cir
- 35 Eagle Ave Unit 7
- 82 Tilton Ave
- 39 Sewell St
- 88 Weston St
- 95 Prospect Terrace
- 508 Oak St Unit 7
Ask me questions while you tour the home.