Estimated Value: $501,167 - $600,000
Studio
--
Bath
2,136
Sq Ft
$253/Sq Ft
Est. Value
About This Home
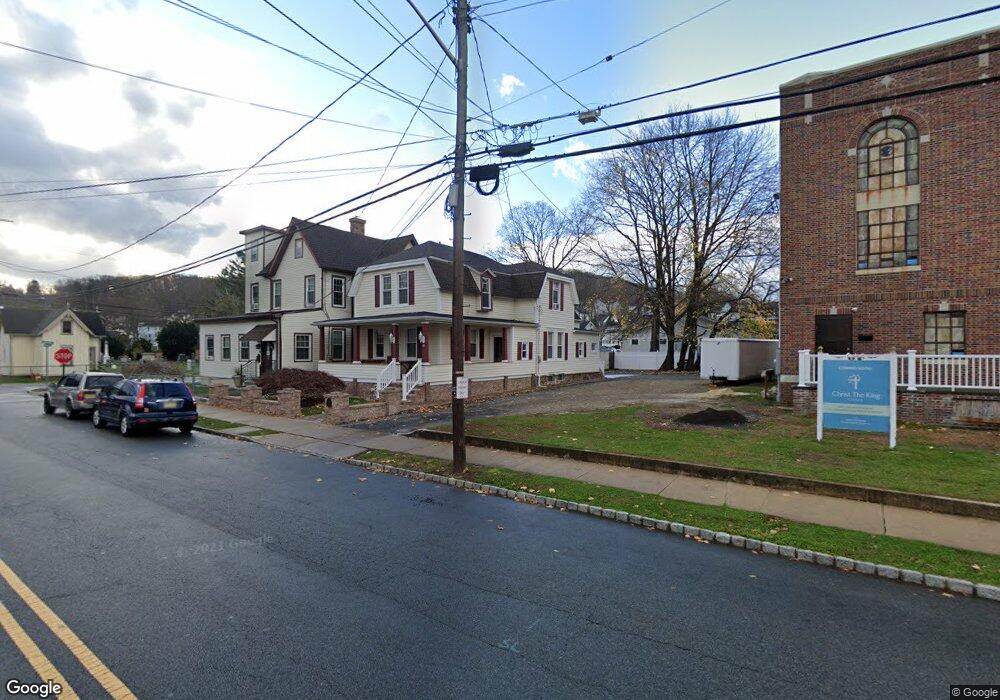
This home is located at 41 Orchard St, Dover, NJ 07801 and is currently estimated at $540,292, approximately $252 per square foot. 41 Orchard St is a home located in Morris County with nearby schools including Dover Middle School and Dover High School.
Ownership History
Date
Name
Owned For
Owner Type
Purchase Details
Closed on
Feb 3, 2000
Sold by
Matos Hector and Matos Adelaida
Bought by
Santiago Evelyn and Orama Oscar
Current Estimated Value
Home Financials for this Owner
Home Financials are based on the most recent Mortgage that was taken out on this home.
Original Mortgage
$151,739
Outstanding Balance
$49,501
Interest Rate
7.98%
Mortgage Type
FHA
Estimated Equity
$490,791
Purchase Details
Closed on
Jun 8, 1999
Sold by
Matos Hector and Matos Adelaida
Bought by
Matos Hector and Matos Adelaida
Create a Home Valuation Report for This Property
The Home Valuation Report is an in-depth analysis detailing your home's value as well as a comparison with similar homes in the area
Home Values in the Area
Average Home Value in this Area
Purchase History
| Date | Buyer | Sale Price | Title Company |
|---|---|---|---|
| Santiago Evelyn | $153,000 | Chicago Title Insurance Co | |
| Matos Hector | -- | -- |
Source: Public Records
Mortgage History
| Date | Status | Borrower | Loan Amount |
|---|---|---|---|
| Open | Santiago Evelyn | $151,739 |
Source: Public Records
Tax History
| Year | Tax Paid | Tax Assessment Tax Assessment Total Assessment is a certain percentage of the fair market value that is determined by local assessors to be the total taxable value of land and additions on the property. | Land | Improvement |
|---|---|---|---|---|
| 2025 | $8,906 | $272,100 | $80,400 | $191,700 |
| 2024 | $8,590 | $272,100 | $80,400 | $191,700 |
Source: Public Records
Map
Nearby Homes
- 142 W Blackwell St
- 58 Conrad Place
- 121 W Clinton St
- 12 Lincoln Ave
- 49 Kearney St
- 121 W Munson Ave
- 179 Pequannock St
- 3 Marble Ln
- 51 Linwood Ave
- 13 James St
- 170 Park Heights Ave
- 8 N Elk Ave
- 417 W Black Well St Ab
- 301 E McFarlan St -A and B
- 4 W Cooper St
- 77B Highland Way
- 174 Baker Ave
- 36 Kitchell Ave
- 67 Victory Ct Unit 67B
- 75 White St
- 43 Orchard St
- 10 Legion Place
- 44 Orchard St Unit A,B,C
- 44 Orchard St
- 28 Orchard St
- 38 Orchard St
- 34 Orchard St
- 107-105 Berry
- 34 Chestnut St
- 21 Orchard St
- 24 Orchard St
- 34 Thompson Ave Unit 36
- 22 Orchard St
- 40 Thompson Ave
- 34-36 Thompson Ave A&b
- 34 Thompson Ave A&b
- 42 Thompson Ave Unit 44
- 40 Chestnut St
- 33 Thompson Ave
- 37 Thompson Ave
Your Personal Tour Guide
Ask me questions while you tour the home.