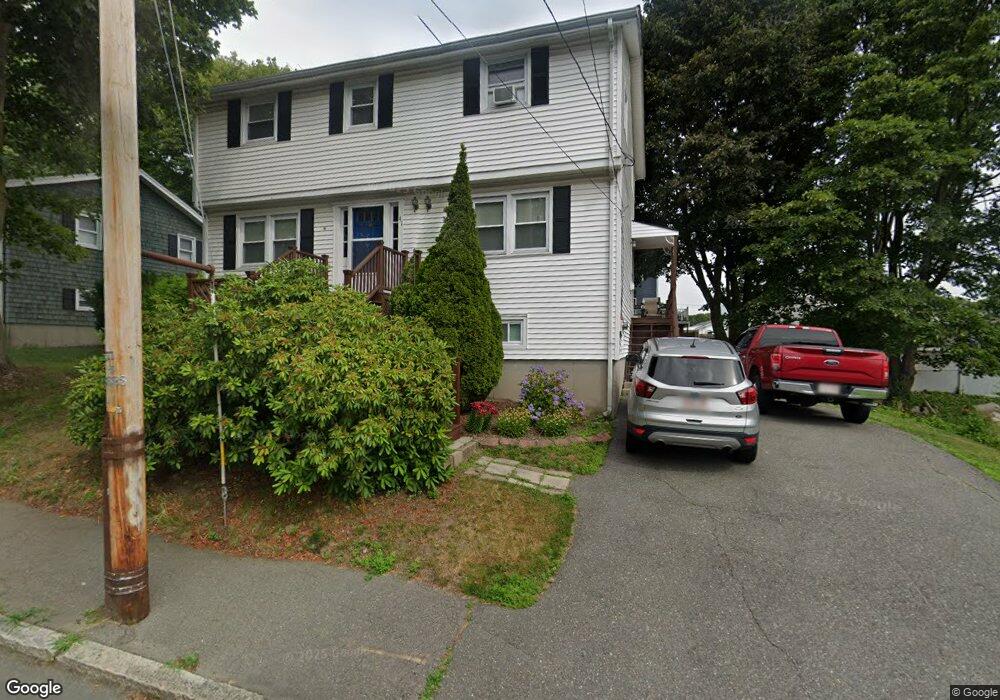
41 Ord St Salem, MA 01970
Gallows Hill NeighborhoodEstimated Value: $603,000 - $744,000
4
Beds
3
Baths
2,032
Sq Ft
$333/Sq Ft
Est. Value
About This Home
This home is located at 41 Ord St, Salem, MA 01970 and is currently estimated at $675,991, approximately $332 per square foot. 41 Ord St is a home located in Essex County with nearby schools including Witchcraft Heights Elementary School, Bates Elementary School, and Horace Mann Laboratory.
Ownership History
Date
Name
Owned For
Owner Type
Purchase Details
Closed on
Jun 29, 1993
Sold by
Charland Michael L and Charland Michele
Bought by
Lindsay John E and Lindsay Nancy
Current Estimated Value
Purchase Details
Closed on
Jun 28, 1991
Sold by
Es Beatrice Koshgarian
Bought by
Charland Charland Michael L Michael L and Michele A Charland
Create a Home Valuation Report for This Property
The Home Valuation Report is an in-depth analysis detailing your home's value as well as a comparison with similar homes in the area
Home Values in the Area
Average Home Value in this Area
Purchase History
We collect this data history from publicly available records. To have your information removed, we recommend requesting removal directly through your county’s website.
| Date | Buyer | Sale Price | Title Company |
|---|---|---|---|
| Lindsay John E | $142,000 | -- | |
| Charland Charland Michael L Michael L | $137,900 | -- |
Source: Public Records
Mortgage History
We collect this data history from publicly available records. To have your information removed, we recommend requesting removal directly through your county’s website.
| Date | Status | Borrower | Loan Amount |
|---|---|---|---|
| Open | Charland Charland Michael L Michael L | $10,000 | |
| Open | Charland Charland Michael L Michael L | $277,000 |
Source: Public Records
Tax History
| Year | Tax Paid | Tax Assessment Tax Assessment Total Assessment is a certain percentage of the fair market value that is determined by local assessors to be the total taxable value of land and additions on the property. | Land | Improvement |
|---|---|---|---|---|
| 2025 | $6,227 | $549,100 | $215,500 | $333,600 |
| 2024 | $6,077 | $523,000 | $204,800 | $318,200 |
| 2023 | $5,771 | $461,300 | $189,100 | $272,200 |
| 2022 | $5,660 | $427,200 | $182,800 | $244,400 |
| 2021 | $5,666 | $410,600 | $170,200 | $240,400 |
| 2020 | $5,667 | $392,200 | $160,700 | $231,500 |
| 2019 | $5,561 | $368,300 | $152,500 | $215,800 |
| 2018 | $5,395 | $350,800 | $144,900 | $205,900 |
| 2017 | $5,093 | $321,100 | $122,300 | $198,800 |
| 2016 | $4,942 | $315,400 | $116,600 | $198,800 |
| 2015 | $4,926 | $300,200 | $107,100 | $193,100 |
Source: Public Records
Map
Nearby Homes
- 65 Ord St
- 3 Witch Way
- 99 Mason St Unit 2
- 4 Valley St
- 24 Tracey St
- 46 Walnut St
- 64 Foster St Unit 403
- 80 Foster St Unit 504
- 434 Essex St Unit 2R
- 394 Essex St Unit 3
- 149 Washington St
- 111 Foster St Unit 416
- 6 Munroe St
- 31 Symonds St Unit 20
- 24 Dunlap St
- 126 1/2 Federal St
- 18 Balcomb St Unit B
- 18 Balcomb St
- 39 Mason St
- 41 Northend St
Your Personal Tour Guide
Ask me questions while you tour the home.