Estimated Value: $113,546 - $208,000
3
Beds
2
Baths
1,264
Sq Ft
$126/Sq Ft
Est. Value
About This Home
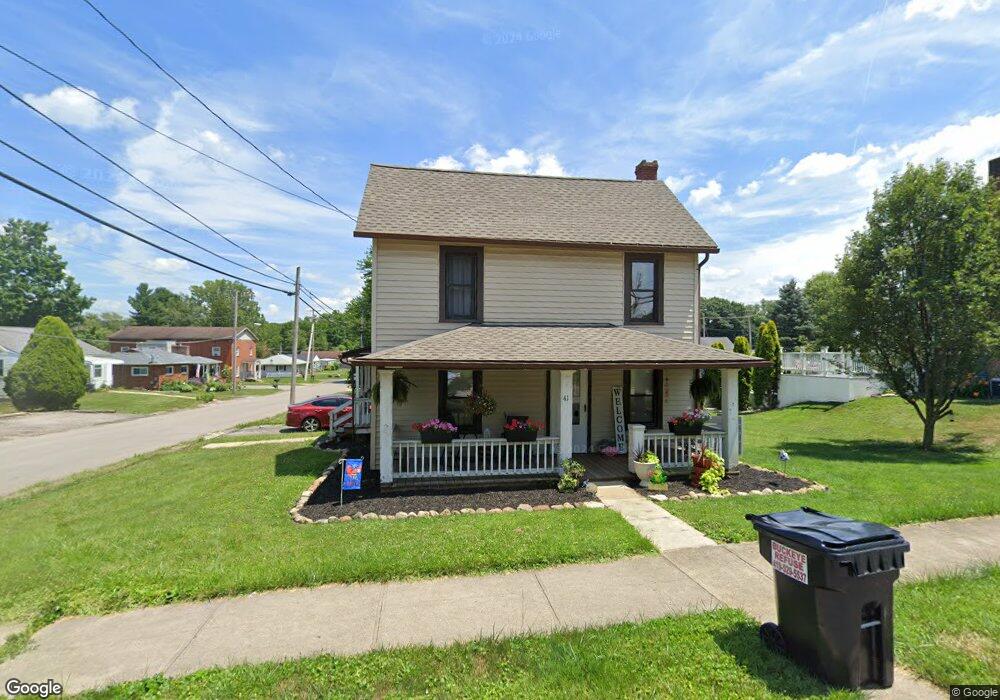
This home is located at 41 Park St, Lucas, OH 44843 and is currently estimated at $158,637, approximately $125 per square foot. 41 Park St is a home located in Richland County with nearby schools including Lucas Elementary School, Lucas Heritage Middle School, and Lucas High School.
Ownership History
Date
Name
Owned For
Owner Type
Purchase Details
Closed on
Oct 5, 2007
Sold by
Us Bank Na
Bought by
International Church Of The Foursquare G
Current Estimated Value
Purchase Details
Closed on
May 18, 2007
Sold by
Byerly Shane
Bought by
Us Bank Na
Purchase Details
Closed on
Apr 15, 2005
Sold by
Sauder Samuel K and Sauder Angel
Bought by
Byerly Shane M and Byerly Tina M
Home Financials for this Owner
Home Financials are based on the most recent Mortgage that was taken out on this home.
Original Mortgage
$65,000
Interest Rate
8.19%
Mortgage Type
Fannie Mae Freddie Mac
Purchase Details
Closed on
Jan 28, 2004
Sold by
Federal National Mortgage Association
Bought by
Sauder Samuel K
Purchase Details
Closed on
Jan 22, 2004
Sold by
Countrywide Home Loan
Bought by
Federal National Mortgage Association
Purchase Details
Closed on
Jun 24, 2003
Sold by
Salyers Lawrence E
Bought by
Countrywide Home Loans
Purchase Details
Closed on
Mar 1, 1985
Create a Home Valuation Report for This Property
The Home Valuation Report is an in-depth analysis detailing your home's value as well as a comparison with similar homes in the area
Home Values in the Area
Average Home Value in this Area
Purchase History
| Date | Buyer | Sale Price | Title Company |
|---|---|---|---|
| International Church Of The Foursquare G | $67,000 | First American Title Ins Co | |
| Us Bank Na | $48,000 | None Available | |
| Byerly Shane M | $79,500 | Chicago Title | |
| Sauder Samuel K | $32,500 | Title First Agency | |
| Federal National Mortgage Association | $32,500 | Title First Agency | |
| Countrywide Home Loans | $50,000 | -- | |
| -- | $19,500 | -- |
Source: Public Records
Mortgage History
| Date | Status | Borrower | Loan Amount |
|---|---|---|---|
| Previous Owner | Byerly Shane M | $65,000 | |
| Closed | Byerly Shane M | $14,500 |
Source: Public Records
Tax History Compared to Growth
Tax History
| Year | Tax Paid | Tax Assessment Tax Assessment Total Assessment is a certain percentage of the fair market value that is determined by local assessors to be the total taxable value of land and additions on the property. | Land | Improvement |
|---|---|---|---|---|
| 2024 | $723 | $31,000 | $4,640 | $26,360 |
| 2023 | $1,314 | $31,000 | $4,640 | $26,360 |
| 2022 | $1,207 | $25,500 | $4,330 | $21,170 |
| 2021 | $1,209 | $25,500 | $4,330 | $21,170 |
| 2020 | $1,229 | $25,500 | $4,330 | $21,170 |
| 2019 | $1,108 | $21,610 | $3,670 | $17,940 |
| 2018 | $1,141 | $21,610 | $3,670 | $17,940 |
| 2017 | $1,150 | $21,610 | $3,670 | $17,940 |
| 2016 | $1,171 | $22,240 | $3,560 | $18,680 |
| 2015 | $1,171 | $22,240 | $3,560 | $18,680 |
| 2014 | $1,177 | $22,240 | $3,560 | $18,680 |
| 2012 | $597 | $22,930 | $3,670 | $19,260 |
Source: Public Records
Map
Nearby Homes
- 0 Moffett Rd
- 174 W Main St
- 2905 Tucker Rd
- 1679 Pulver Rd
- 0 Mount Zion Rd Unit 9069748
- 3261 Moffett Rd
- 1307 Sweetbriar Dr
- 2221 Pleasant Valley Rd
- 0 Applegate Rd
- 0 Tucker Rd
- 2428 Applegate Rd
- 1135 E Hanley Rd
- 2061 Washington North Rd
- 1875 Mansfield Lucas Rd
- 0 State Route 39 & I-71 Northeast Quadrant
- 0 State Route 39 & I-71 Southeast Quadrant
- 0 Garver Rd Washington Rd S Unit 20253648
- 929 Antionette Dr
- 0 Peterson Rd
- 0 Garver Washington Rd S