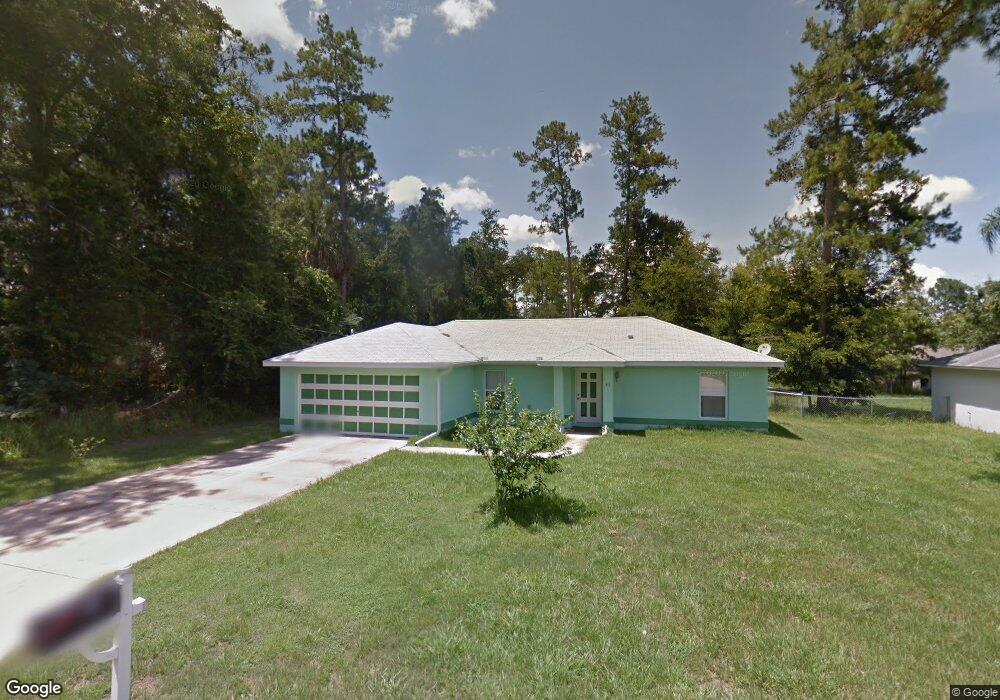
41 Pecan Loop Ocala, FL 34472
Silver Spring Shores NeighborhoodEstimated Value: $215,000 - $237,000
3
Beds
2
Baths
1,191
Sq Ft
$190/Sq Ft
Est. Value
About This Home
This home is located at 41 Pecan Loop, Ocala, FL 34472 and is currently estimated at $226,241, approximately $189 per square foot. 41 Pecan Loop is a home located in Marion County with nearby schools including Greenway Elementary School, Fort King Middle School, and Forest High School.
Ownership History
Date
Name
Owned For
Owner Type
Purchase Details
Closed on
Feb 17, 2016
Sold by
Discovery Homes Llc
Bought by
Zilai Victoria L and Zilai Erich C
Current Estimated Value
Home Financials for this Owner
Home Financials are based on the most recent Mortgage that was taken out on this home.
Original Mortgage
$102,313
Outstanding Balance
$80,963
Interest Rate
3.97%
Mortgage Type
New Conventional
Estimated Equity
$145,278
Purchase Details
Closed on
Oct 16, 2015
Sold by
Lamesa Paul M and United States Of America Depar
Bought by
Discovery Homes Llc
Purchase Details
Closed on
Nov 13, 2007
Sold by
Bongiorno Jo Ann
Bought by
Lamesa Paul
Home Financials for this Owner
Home Financials are based on the most recent Mortgage that was taken out on this home.
Original Mortgage
$133,878
Interest Rate
6.32%
Mortgage Type
Construction
Purchase Details
Closed on
Nov 14, 2006
Sold by
Infantolino Mary
Bought by
Bongiomo Jo Ann
Create a Home Valuation Report for This Property
The Home Valuation Report is an in-depth analysis detailing your home's value as well as a comparison with similar homes in the area
Home Values in the Area
Average Home Value in this Area
Purchase History
| Date | Buyer | Sale Price | Title Company |
|---|---|---|---|
| Zilai Victoria L | $99,500 | Affiliated Title Central Fl | |
| Discovery Homes Llc | $70,600 | None Available | |
| Lamesa Paul | $21,900 | 1St Quality Title Llc | |
| Bongiomo Jo Ann | -- | None Available |
Source: Public Records
Mortgage History
| Date | Status | Borrower | Loan Amount |
|---|---|---|---|
| Open | Zilai Victoria L | $102,313 | |
| Previous Owner | Lamesa Paul | $133,878 |
Source: Public Records
Tax History
| Year | Tax Paid | Tax Assessment Tax Assessment Total Assessment is a certain percentage of the fair market value that is determined by local assessors to be the total taxable value of land and additions on the property. | Land | Improvement |
|---|---|---|---|---|
| 2025 | $1,608 | $108,128 | -- | -- |
| 2024 | $1,370 | $105,081 | -- | -- |
| 2023 | $1,332 | $102,020 | $0 | $0 |
| 2022 | $1,291 | $99,049 | $0 | $0 |
| 2021 | $1,280 | $96,164 | $0 | $0 |
| 2020 | $1,267 | $94,836 | $0 | $0 |
| 2019 | $1,244 | $92,704 | $0 | $0 |
| 2018 | $1,187 | $90,975 | $0 | $0 |
| 2017 | $1,165 | $89,104 | $5,200 | $83,904 |
| 2016 | $1,594 | $77,757 | $0 | $0 |
| 2015 | $1,512 | $71,873 | $0 | $0 |
| 2014 | $1,423 | $70,167 | $0 | $0 |
Source: Public Records
Map
Nearby Homes
- 6 Fir Drive Trace
- 5410 Pecan Rd
- 13 Redwood Run Track
- 7 Pecan Drive Loop
- 16 Pecan Drive Loop
- 37 Fir Drive Trace
- 4 Redwood Trace Ct
- 5 Hemlock Terrace Pass
- 15 Pecan Drive Pass
- 22 Hemlock Circle Pass
- 5122 Pecan Rd
- 3 Redwood Rd
- 24 Hemlock Circle Pass
- 6191 Hemlock Rd
- 2 Pecan Drive Place
- 30 Pecan Drive Pass
- 9 Pecan Radial
- 81 Pecan Dr
- 61 Fir Dr
- 35 Pecan Drive Pass
Your Personal Tour Guide
Ask me questions while you tour the home.