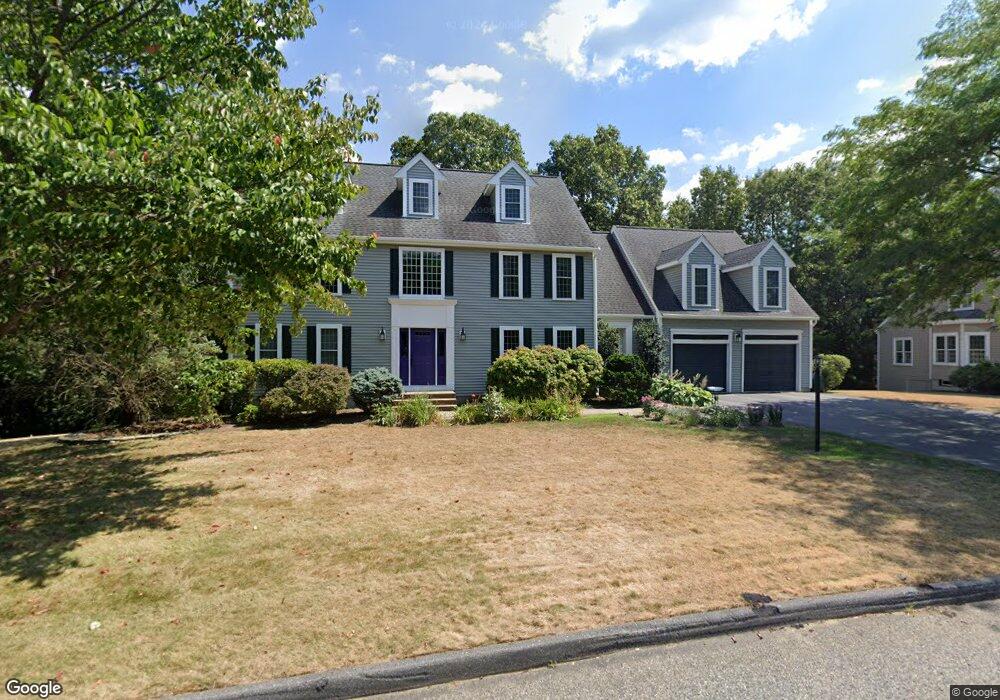
41 Piccadilly Way Westborough, MA 01581
Estimated Value: $1,289,000 - $1,291,119
4
Beds
3
Baths
3,707
Sq Ft
$348/Sq Ft
Est. Value
About This Home
This home is located at 41 Piccadilly Way, Westborough, MA 01581 and is currently estimated at $1,289,780, approximately $347 per square foot. 41 Piccadilly Way is a home located in Worcester County with nearby schools including Westborough High School, Ebridge Montessori School, and Westboro Knowledge Beginnings.
Ownership History
Date
Name
Owned For
Owner Type
Purchase Details
Closed on
Jun 15, 2007
Sold by
Doretti Chiara M and Doretti Joseph T
Bought by
Vaver Anthony T and Heller Martha P
Current Estimated Value
Home Financials for this Owner
Home Financials are based on the most recent Mortgage that was taken out on this home.
Original Mortgage
$546,800
Outstanding Balance
$334,584
Interest Rate
6.19%
Mortgage Type
Purchase Money Mortgage
Estimated Equity
$955,196
Purchase Details
Closed on
Mar 31, 2000
Sold by
Nelson Douglas D and Nelson Cynthia J
Bought by
Doretti Joseph T and Doretti Chiara M
Purchase Details
Closed on
Jun 17, 1998
Sold by
Cochran Richard L and Cochran Mary D
Bought by
Nelson Douglas D and Nelson Cynthia J
Purchase Details
Closed on
Jun 28, 1996
Sold by
Carruth Capital Corp
Bought by
Cochran Richard L and Cochran Mary D
Create a Home Valuation Report for This Property
The Home Valuation Report is an in-depth analysis detailing your home's value as well as a comparison with similar homes in the area
Home Values in the Area
Average Home Value in this Area
Purchase History
| Date | Buyer | Sale Price | Title Company |
|---|---|---|---|
| Vaver Anthony T | $683,500 | -- | |
| Doretti Joseph T | $472,500 | -- | |
| Nelson Douglas D | $427,000 | -- | |
| Cochran Richard L | $396,000 | -- |
Source: Public Records
Mortgage History
| Date | Status | Borrower | Loan Amount |
|---|---|---|---|
| Open | Vaver Anthony T | $546,800 | |
| Previous Owner | Cochran Richard L | $80,000 | |
| Previous Owner | Cochran Richard L | $50,000 | |
| Previous Owner | Cochran Richard L | $275,000 |
Source: Public Records
Tax History Compared to Growth
Tax History
| Year | Tax Paid | Tax Assessment Tax Assessment Total Assessment is a certain percentage of the fair market value that is determined by local assessors to be the total taxable value of land and additions on the property. | Land | Improvement |
|---|---|---|---|---|
| 2025 | $16,572 | $1,017,300 | $349,900 | $667,400 |
| 2024 | $15,816 | $963,800 | $333,000 | $630,800 |
| 2023 | $14,636 | $869,100 | $314,200 | $554,900 |
| 2022 | $13,431 | $726,400 | $250,300 | $476,100 |
| 2021 | $13,280 | $716,300 | $240,200 | $476,100 |
| 2020 | $13,156 | $718,100 | $254,200 | $463,900 |
| 2019 | $13,251 | $722,900 | $250,200 | $472,700 |
| 2018 | $12,293 | $665,900 | $240,200 | $425,700 |
| 2017 | $11,853 | $665,900 | $240,200 | $425,700 |
| 2016 | $11,908 | $670,100 | $240,200 | $429,900 |
| 2015 | $11,409 | $613,700 | $212,200 | $401,500 |
Source: Public Records
Map
Nearby Homes
- 39 Piccadilly Way
- 37 Piccadilly Way
- 36 Piccadilly Way
- 32 Piccadilly Way
- 38 Piccadilly Way
- 2 Grindstone Ct
- 47 Piccadilly Way
- 30 Piccadilly Way
- 9 Belknap St
- 40 Piccadilly Way
- 7 Belknap St
- 4 Grindstone Ct
- 11 Belknap St
- 35 Piccadilly Way
- 5 Belknap St
- 13 Belknap St
- 3 Belknap St
- 3 Belknap St Unit 3
- 3 Grindstone Ct
- 58 Piccadilly Way