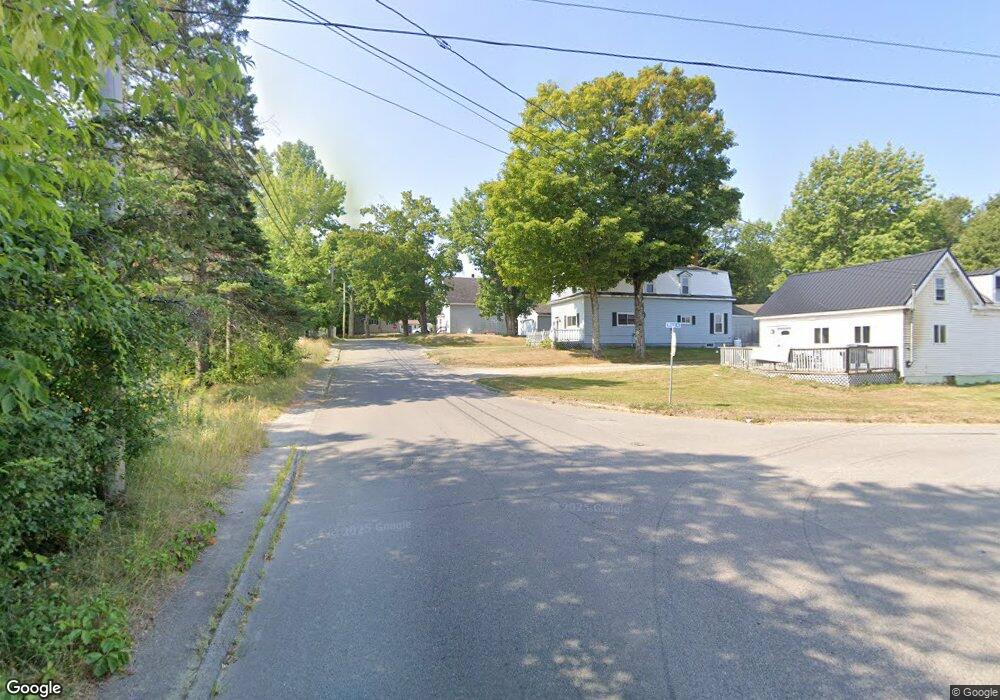
41 Price St Calais, ME 04619
Estimated Value: $111,723 - $132,000
2
Beds
2
Baths
551
Sq Ft
$219/Sq Ft
Est. Value
About This Home
This home is located at 41 Price St, Calais, ME 04619 and is currently estimated at $120,431, approximately $218 per square foot. 41 Price St is a home with nearby schools including Calais Elementary School and Calais Middle/High School.
Ownership History
Date
Name
Owned For
Owner Type
Purchase Details
Closed on
Nov 21, 2013
Sold by
Redding Roxanne and Redding Gary M
Bought by
Bishop Nicholas J
Current Estimated Value
Home Financials for this Owner
Home Financials are based on the most recent Mortgage that was taken out on this home.
Original Mortgage
$45,900
Outstanding Balance
$34,257
Interest Rate
4.25%
Mortgage Type
New Conventional
Estimated Equity
$86,174
Purchase Details
Closed on
Mar 21, 2005
Sold by
Mcphee Charles
Bought by
Redding Roxanne and Redding Gary
Home Financials for this Owner
Home Financials are based on the most recent Mortgage that was taken out on this home.
Original Mortgage
$31,000
Interest Rate
5.64%
Mortgage Type
Stand Alone Second
Create a Home Valuation Report for This Property
The Home Valuation Report is an in-depth analysis detailing your home's value as well as a comparison with similar homes in the area
Home Values in the Area
Average Home Value in this Area
Purchase History
| Date | Buyer | Sale Price | Title Company |
|---|---|---|---|
| Bishop Nicholas J | -- | -- | |
| Redding Roxanne | -- | -- |
Source: Public Records
Mortgage History
| Date | Status | Borrower | Loan Amount |
|---|---|---|---|
| Open | Bishop Nicholas J | $45,900 | |
| Previous Owner | Redding Roxanne | $31,000 |
Source: Public Records
Tax History Compared to Growth
Tax History
| Year | Tax Paid | Tax Assessment Tax Assessment Total Assessment is a certain percentage of the fair market value that is determined by local assessors to be the total taxable value of land and additions on the property. | Land | Improvement |
|---|---|---|---|---|
| 2024 | $1,215 | $81,000 | $9,400 | $71,600 |
| 2023 | $1,188 | $69,900 | $8,100 | $61,800 |
| 2022 | $1,074 | $56,500 | $6,600 | $49,900 |
| 2021 | $1,171 | $54,200 | $6,300 | $47,900 |
| 2020 | $1,171 | $46,300 | $5,400 | $40,900 |
| 2019 | $1,171 | $46,300 | $5,400 | $40,900 |
| 2018 | $1,171 | $46,300 | $5,400 | $40,900 |
| 2017 | $1,171 | $46,300 | $5,400 | $40,900 |
| 2016 | $1,171 | $46,300 | $5,400 | $40,900 |
| 2015 | $1,171 | $46,300 | $5,400 | $40,900 |
| 2014 | $1,171 | $46,300 | $5,400 | $40,900 |
| 2013 | $1,171 | $46,300 | $5,400 | $40,900 |
Source: Public Records
Map
Nearby Homes