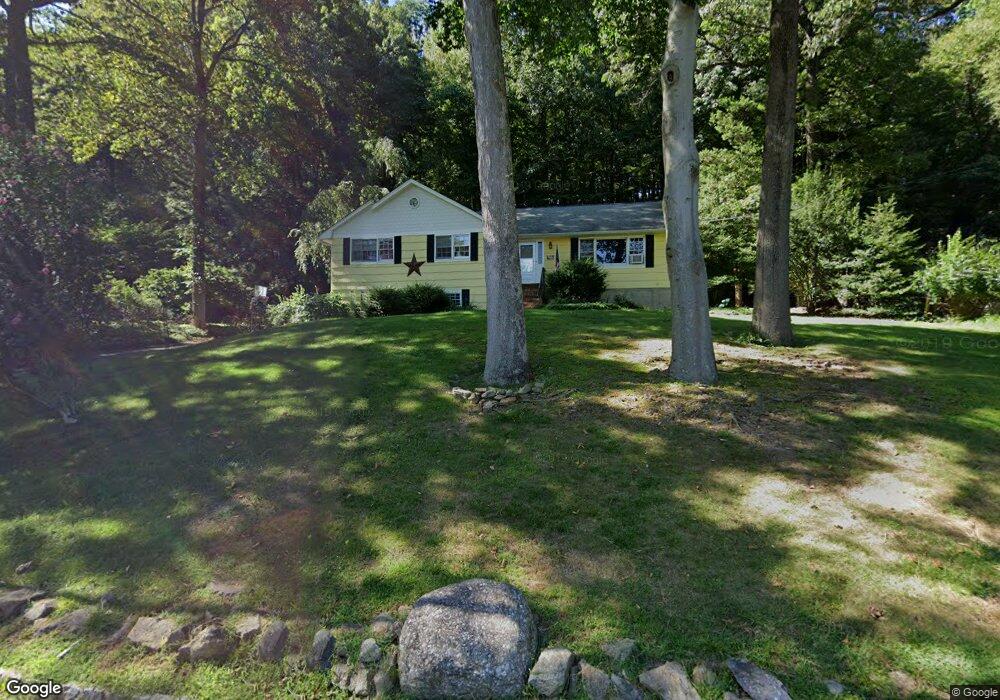
41 Radtke Rd Randolph, NJ 07869
Estimated Value: $575,000 - $728,000
--
Bed
--
Bath
1,604
Sq Ft
$417/Sq Ft
Est. Value
About This Home
This home is located at 41 Radtke Rd, Randolph, NJ 07869 and is currently estimated at $668,424, approximately $416 per square foot. 41 Radtke Rd is a home located in Morris County with nearby schools including Randolph High School, Randolph Middle School, and Apple Montessori Schools and Camps - Randolph.
Ownership History
Date
Name
Owned For
Owner Type
Purchase Details
Closed on
Jul 13, 2000
Sold by
Gallagher Robert Dennis and Burton Grace G
Bought by
Prideaux Scott M and Prideaux Janet A
Current Estimated Value
Home Financials for this Owner
Home Financials are based on the most recent Mortgage that was taken out on this home.
Original Mortgage
$232,000
Outstanding Balance
$83,311
Interest Rate
8.28%
Mortgage Type
Stand Alone First
Estimated Equity
$585,113
Create a Home Valuation Report for This Property
The Home Valuation Report is an in-depth analysis detailing your home's value as well as a comparison with similar homes in the area
Home Values in the Area
Average Home Value in this Area
Purchase History
| Date | Buyer | Sale Price | Title Company |
|---|---|---|---|
| Prideaux Scott M | $258,000 | -- |
Source: Public Records
Mortgage History
| Date | Status | Borrower | Loan Amount |
|---|---|---|---|
| Open | Prideaux Scott M | $232,000 |
Source: Public Records
Tax History Compared to Growth
Tax History
| Year | Tax Paid | Tax Assessment Tax Assessment Total Assessment is a certain percentage of the fair market value that is determined by local assessors to be the total taxable value of land and additions on the property. | Land | Improvement |
|---|---|---|---|---|
| 2025 | $10,786 | $381,000 | $192,500 | $188,500 |
| 2024 | $10,516 | $381,000 | $192,500 | $188,500 |
| 2023 | $10,516 | $381,000 | $192,500 | $188,500 |
| 2022 | $10,104 | $381,000 | $192,500 | $188,500 |
| 2021 | $10,104 | $381,000 | $192,500 | $188,500 |
| 2020 | $10,001 | $381,000 | $192,500 | $188,500 |
| 2019 | $9,887 | $381,000 | $192,500 | $188,500 |
| 2018 | $9,761 | $381,000 | $192,500 | $188,500 |
| 2017 | $9,639 | $381,000 | $192,500 | $188,500 |
| 2016 | $8,857 | $242,000 | $129,400 | $112,600 |
| 2015 | $8,751 | $242,000 | $129,400 | $112,600 |
| 2014 | $8,615 | $242,000 | $129,400 | $112,600 |
Source: Public Records
Map
Nearby Homes