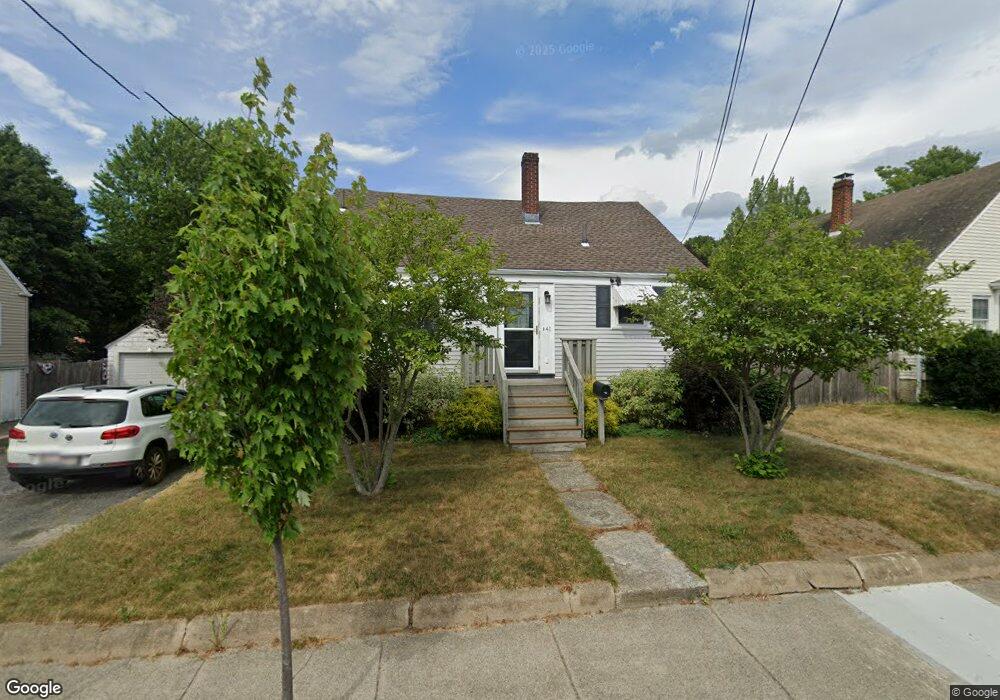
41 Raymond Rd Salem, MA 01970
South Salem NeighborhoodEstimated Value: $547,179 - $799,000
2
Beds
1
Bath
1,860
Sq Ft
$363/Sq Ft
Est. Value
About This Home
This home is located at 41 Raymond Rd, Salem, MA 01970 and is currently estimated at $675,295, approximately $363 per square foot. 41 Raymond Rd is a home located in Essex County with nearby schools including Saltonstall School, Horace Mann Laboratory, and Carlton Elementary School.
Ownership History
Date
Name
Owned For
Owner Type
Purchase Details
Closed on
Oct 4, 2011
Sold by
Mclaughlin Carol and Pelletier Richard E
Bought by
Pelletier Richard E and Pelletier Erica M
Current Estimated Value
Home Financials for this Owner
Home Financials are based on the most recent Mortgage that was taken out on this home.
Original Mortgage
$180,000
Outstanding Balance
$123,063
Interest Rate
4.15%
Mortgage Type
Purchase Money Mortgage
Estimated Equity
$552,232
Purchase Details
Closed on
Apr 3, 2009
Sold by
Mclaughlin Carol
Bought by
Mclaughlin Carol
Create a Home Valuation Report for This Property
The Home Valuation Report is an in-depth analysis detailing your home's value as well as a comparison with similar homes in the area
Home Values in the Area
Average Home Value in this Area
Purchase History
| Date | Buyer | Sale Price | Title Company |
|---|---|---|---|
| Pelletier Richard E | $100,000 | -- | |
| Mclaughlin Carol | -- | -- |
Source: Public Records
Mortgage History
| Date | Status | Borrower | Loan Amount |
|---|---|---|---|
| Open | Mclaughlin Carol | $180,000 |
Source: Public Records
Tax History Compared to Growth
Tax History
| Year | Tax Paid | Tax Assessment Tax Assessment Total Assessment is a certain percentage of the fair market value that is determined by local assessors to be the total taxable value of land and additions on the property. | Land | Improvement |
|---|---|---|---|---|
| 2025 | $5,650 | $498,200 | $182,500 | $315,700 |
| 2024 | $5,624 | $484,000 | $182,500 | $301,500 |
| 2023 | $5,434 | $434,400 | $167,000 | $267,400 |
| 2022 | $5,427 | $409,600 | $160,800 | $248,800 |
| 2021 | $5,187 | $375,900 | $160,800 | $215,100 |
| 2020 | $4,643 | $321,300 | $151,500 | $169,800 |
| 2019 | $4,618 | $305,800 | $144,100 | $161,700 |
| 2018 | $4,420 | $287,400 | $137,300 | $150,100 |
| 2017 | $4,311 | $271,800 | $129,900 | $141,900 |
| 2016 | $4,016 | $256,300 | $114,400 | $141,900 |
| 2015 | $3,894 | $237,300 | $105,100 | $132,200 |
Source: Public Records
Map
Nearby Homes
- 11 Sumner Rd
- 10 Quadrant Rd
- 24 Wisteria St Unit 2
- 327 Lafayette St Unit 2
- 23 Marion Rd Unit B
- 17 Cliff St
- 2 Fletcher Way Unit 34D
- 263 Jefferson Ave
- 4 Willow Ave Unit 2
- 83 Lafayette St
- 29 Willson St
- 10 Horton St
- 1 Laurent Rd Unit 3
- 10 Hazel St Unit 2
- 9 Glover St Unit 1
- 2 Wilfred Terrace
- 2 Martin St
- 25 Tedesco St
- 59 Leach St Unit 2
- 3 Oak St