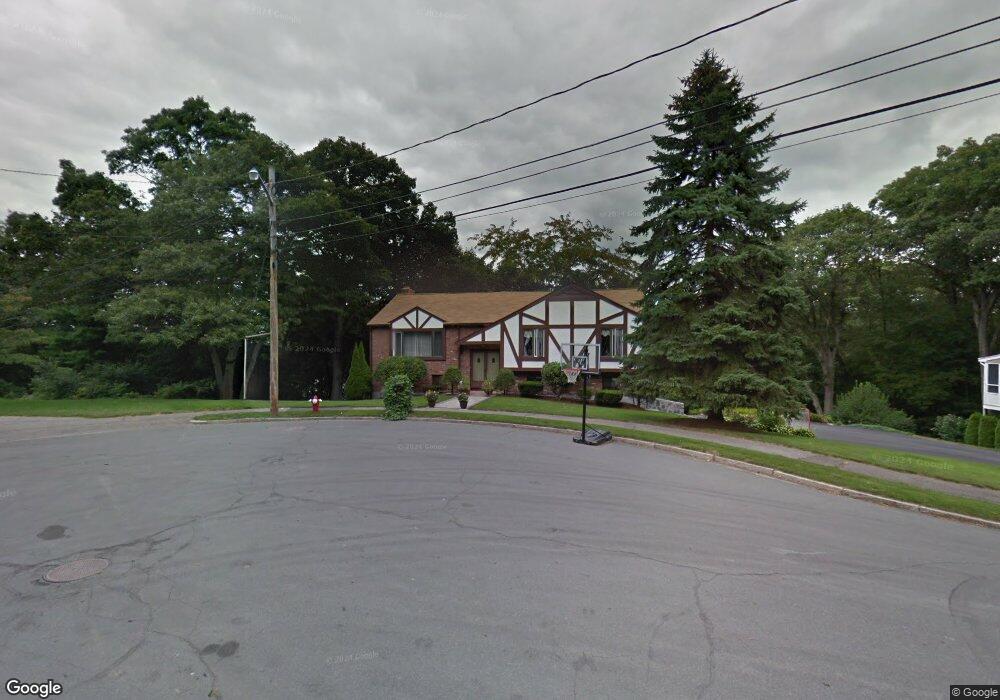
41 Reynolds Rd Wakefield, MA 01880
Woodville NeighborhoodEstimated Value: $941,168 - $1,044,000
3
Beds
3
Baths
2,622
Sq Ft
$379/Sq Ft
Est. Value
About This Home
This home is located at 41 Reynolds Rd, Wakefield, MA 01880 and is currently estimated at $995,042, approximately $379 per square foot. 41 Reynolds Rd is a home located in Middlesex County with nearby schools including Wakefield Memorial High School, St Joseph School, and Odyssey Day School.
Ownership History
Date
Name
Owned For
Owner Type
Purchase Details
Closed on
Oct 19, 2017
Sold by
Sallade Christopher and Sallade Margaret M
Bought by
Sallade Ft
Current Estimated Value
Purchase Details
Closed on
Jun 17, 1992
Sold by
Renee Rt
Bought by
Sallade Christopher and Moskwa Margaret M
Home Financials for this Owner
Home Financials are based on the most recent Mortgage that was taken out on this home.
Original Mortgage
$148,800
Interest Rate
8.67%
Mortgage Type
Purchase Money Mortgage
Create a Home Valuation Report for This Property
The Home Valuation Report is an in-depth analysis detailing your home's value as well as a comparison with similar homes in the area
Home Values in the Area
Average Home Value in this Area
Purchase History
| Date | Buyer | Sale Price | Title Company |
|---|---|---|---|
| Sallade Ft | -- | -- | |
| Sallade Christopher | $186,000 | -- |
Source: Public Records
Mortgage History
| Date | Status | Borrower | Loan Amount |
|---|---|---|---|
| Previous Owner | Sallade Christopher | $148,800 |
Source: Public Records
Tax History
| Year | Tax Paid | Tax Assessment Tax Assessment Total Assessment is a certain percentage of the fair market value that is determined by local assessors to be the total taxable value of land and additions on the property. | Land | Improvement |
|---|---|---|---|---|
| 2025 | $9,256 | $815,500 | $411,500 | $404,000 |
| 2024 | $8,904 | $791,500 | $399,400 | $392,100 |
| 2023 | $8,597 | $732,900 | $369,800 | $363,100 |
| 2022 | $8,210 | $666,400 | $336,200 | $330,200 |
| 2021 | $8,213 | $645,200 | $312,400 | $332,800 |
| 2020 | $7,900 | $618,600 | $299,500 | $319,100 |
| 2019 | $7,662 | $597,200 | $289,200 | $308,000 |
| 2018 | $7,251 | $559,900 | $271,100 | $288,800 |
| 2017 | $6,948 | $533,200 | $258,200 | $275,000 |
| 2016 | $6,514 | $482,900 | $238,700 | $244,200 |
| 2015 | $6,085 | $451,400 | $223,100 | $228,300 |
| 2014 | $5,591 | $437,500 | $216,200 | $221,300 |
Source: Public Records
Map
Nearby Homes
- 177 Oak St
- 70 Old Nahant Rd
- 0 Everett St
- 1 Sidney St
- 824 Main St Unit 1
- 38 Bennett St Unit 3D
- 15 Hickory Hill Rd
- 34 Golden Hills Rd
- 68 Preston St Unit 6D
- 9 Ledge St
- 7 West St
- 93 Sweetwater St
- 176 Bay State Rd
- 43-45 Crescent St
- 9 Lovis Ave
- 69 Foundry St Unit 310
- 69 Foundry St Unit 416
- 16 Pleasant St
- 62 Foundry St Unit 310
- 62 Foundry St Unit 312
Your Personal Tour Guide
Ask me questions while you tour the home.