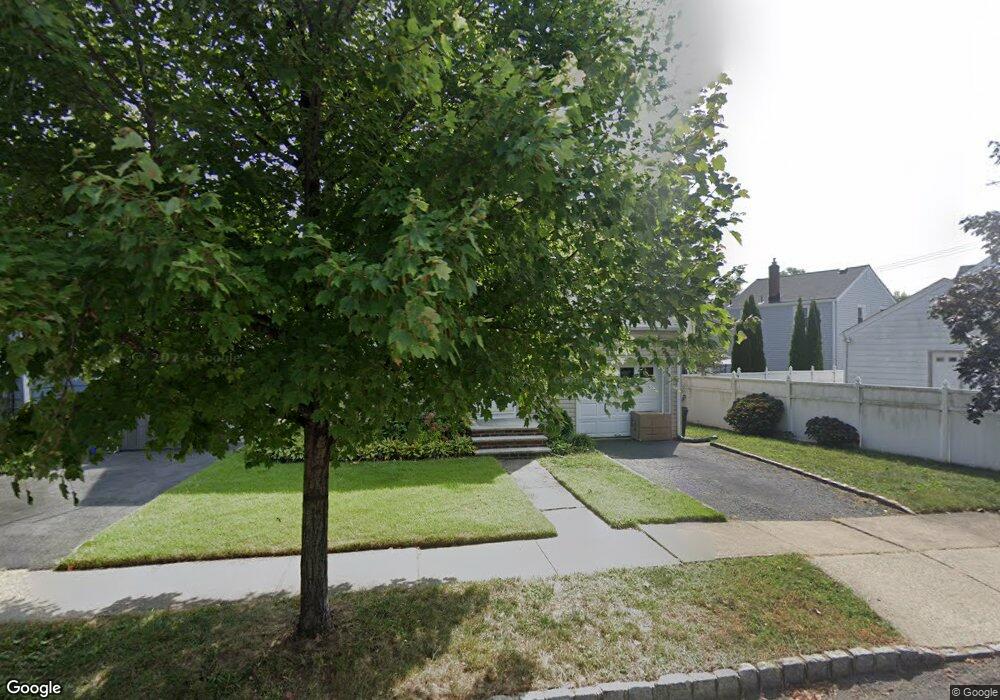
41 Ridge Ave Bloomfield, NJ 07003
Estimated Value: $484,761 - $542,000
--
Bed
--
Bath
1,077
Sq Ft
$480/Sq Ft
Est. Value
About This Home
This home is located at 41 Ridge Ave, Bloomfield, NJ 07003 and is currently estimated at $516,440, approximately $479 per square foot. 41 Ridge Ave is a home located in Essex County with nearby schools including Franklin School, Bloomfield Middle School, and Bloomfield High School.
Ownership History
Date
Name
Owned For
Owner Type
Purchase Details
Closed on
Feb 6, 2001
Sold by
Gruchacz Michael J
Bought by
Gaffney Leonor M
Current Estimated Value
Home Financials for this Owner
Home Financials are based on the most recent Mortgage that was taken out on this home.
Original Mortgage
$147,150
Outstanding Balance
$53,351
Interest Rate
7.13%
Estimated Equity
$463,089
Purchase Details
Closed on
Feb 5, 2001
Home Financials for this Owner
Home Financials are based on the most recent Mortgage that was taken out on this home.
Original Mortgage
$147,150
Outstanding Balance
$53,351
Interest Rate
7.13%
Estimated Equity
$463,089
Create a Home Valuation Report for This Property
The Home Valuation Report is an in-depth analysis detailing your home's value as well as a comparison with similar homes in the area
Home Values in the Area
Average Home Value in this Area
Purchase History
| Date | Buyer | Sale Price | Title Company |
|---|---|---|---|
| Gaffney Leonor M | $163,500 | -- | |
| -- | $163,000 | -- |
Source: Public Records
Mortgage History
| Date | Status | Borrower | Loan Amount |
|---|---|---|---|
| Open | Gaffney Leonor M | $147,150 |
Source: Public Records
Tax History Compared to Growth
Tax History
| Year | Tax Paid | Tax Assessment Tax Assessment Total Assessment is a certain percentage of the fair market value that is determined by local assessors to be the total taxable value of land and additions on the property. | Land | Improvement |
|---|---|---|---|---|
| 2025 | $10,425 | $319,000 | $129,200 | $189,800 |
| 2024 | $10,425 | $319,000 | $129,200 | $189,800 |
| 2022 | $10,214 | $319,000 | $129,200 | $189,800 |
| 2021 | $10,026 | $319,000 | $129,200 | $189,800 |
| 2020 | $9,873 | $319,000 | $129,200 | $189,800 |
| 2019 | $9,511 | $238,900 | $128,000 | $110,900 |
| 2018 | $9,470 | $238,900 | $128,000 | $110,900 |
| 2017 | $9,327 | $238,900 | $128,000 | $110,900 |
| 2016 | $9,222 | $238,900 | $128,000 | $110,900 |
| 2015 | $9,138 | $238,900 | $128,000 | $110,900 |
| 2014 | $8,971 | $238,900 | $128,000 | $110,900 |
Source: Public Records
Map
Nearby Homes
- 27 Gillespie Rd
- 50 James St Unit 3
- 31 Spring St
- 366 Hoover Ave Unit 119
- 322 Hoover Ave Unit 73
- 328 Hoover Ave
- 328-330 Hoover Ave
- 298 Hoover Ave Unit 28
- 267 Hoover Ave
- 73 Hoover Ave
- 10 Almira St Unit 14
- 10 14almira St
- 170 Pake St
- 28 Forest Dr
- 40 Brighton Ave
- 48 Broughton Ave
- 48 Broughton Ave Unit 2
- 39 Forest Dr
- 18 Birch St
- 47 Elston St