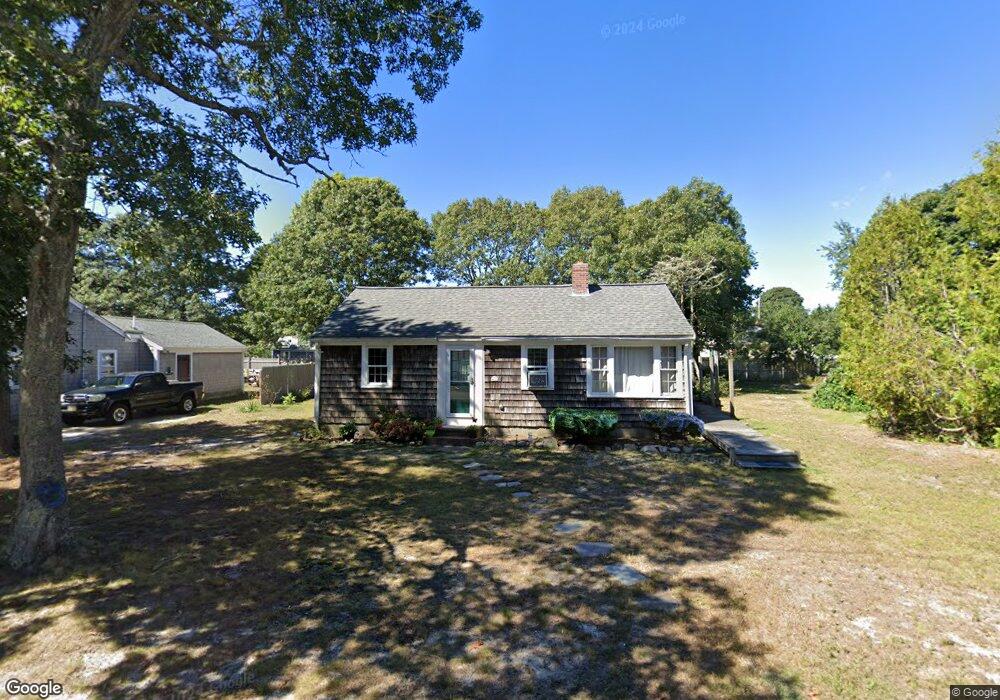
41 Ruby St West Yarmouth, MA 02673
West Yarmouth NeighborhoodEstimated Value: $435,000 - $463,000
2
Beds
1
Bath
748
Sq Ft
$598/Sq Ft
Est. Value
About This Home
This home is located at 41 Ruby St, West Yarmouth, MA 02673 and is currently estimated at $447,259, approximately $597 per square foot. 41 Ruby St is a home located in Barnstable County with nearby schools including Dennis-Yarmouth Regional High School, Sturgis Charter Public School, and St. Pius X. School.
Ownership History
Date
Name
Owned For
Owner Type
Purchase Details
Closed on
Feb 19, 2019
Sold by
Robert V Valeri Ft
Bought by
Robert V Valeri Ret
Current Estimated Value
Purchase Details
Closed on
Dec 9, 2014
Sold by
Valeri Robert V
Bought by
Robert V Valeri Ft
Create a Home Valuation Report for This Property
The Home Valuation Report is an in-depth analysis detailing your home's value as well as a comparison with similar homes in the area
Home Values in the Area
Average Home Value in this Area
Purchase History
| Date | Buyer | Sale Price | Title Company |
|---|---|---|---|
| Robert V Valeri Ret | -- | -- | |
| Robert V Valeri Ft | -- | -- |
Source: Public Records
Tax History
| Year | Tax Paid | Tax Assessment Tax Assessment Total Assessment is a certain percentage of the fair market value that is determined by local assessors to be the total taxable value of land and additions on the property. | Land | Improvement |
|---|---|---|---|---|
| 2025 | $2,525 | $356,600 | $154,800 | $201,800 |
| 2024 | $2,333 | $316,100 | $130,800 | $185,300 |
| 2023 | $2,249 | $277,300 | $113,300 | $164,000 |
| 2022 | $2,141 | $233,200 | $103,000 | $130,200 |
| 2021 | $2,037 | $213,100 | $103,000 | $110,100 |
| 2020 | $7,601 | $201,000 | $103,000 | $98,000 |
| 2019 | $1,885 | $186,600 | $103,000 | $83,600 |
| 2018 | $1,763 | $171,300 | $87,700 | $83,600 |
| 2017 | $1,678 | $167,500 | $83,900 | $83,600 |
| 2016 | $1,596 | $159,900 | $76,300 | $83,600 |
| 2015 | $1,500 | $149,400 | $76,300 | $73,100 |
Source: Public Records
Map
Nearby Homes
- 54 Boxberry Ln
- 16 Elton Rd
- 11 Hudson Rd
- 2 Candlewood Ln
- 22-24 Wildwood Path
- 22-24 Wildwood Path
- 15 Reid Ave
- 69 Abells Rd
- 32 Niagara Ln
- 36 Pawnee Rd
- 55 Pawkannawkut Dr
- 11 Makepeace Ln
- 46 Pawkannawkut Dr
- 27 Angus Ave
- 11 Makepeace Ln
- 17 Angus Ave
- 36 Pine Cone Dr
- 16 Yacht Ave
- 11 Elizabeth Ln
- 844 Route 28 Unit 7B