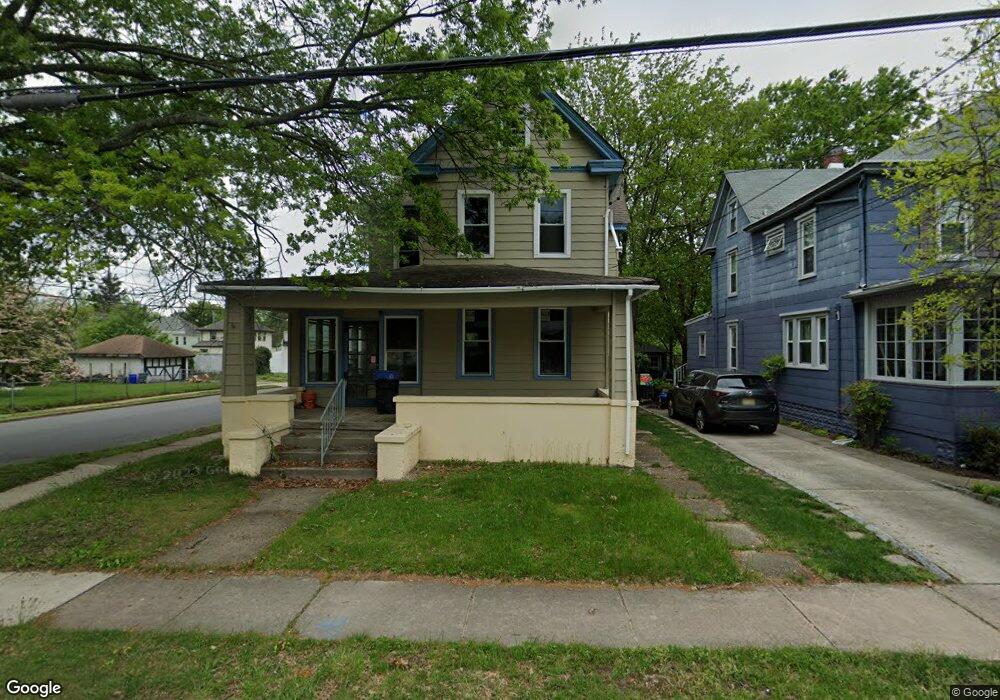
41 S Davis St Woodbury, NJ 08096
Estimated Value: $186,233 - $314,000
--
Bed
--
Bath
1,817
Sq Ft
$137/Sq Ft
Est. Value
About This Home
This home is located at 41 S Davis St, Woodbury, NJ 08096 and is currently estimated at $249,808, approximately $137 per square foot. 41 S Davis St is a home located in Gloucester County with nearby schools including Woodbury Junior/Senior High School and Holy Angels Catholic School.
Ownership History
Date
Name
Owned For
Owner Type
Purchase Details
Closed on
Jan 19, 2018
Sold by
Nationstar Mortgage Llc
Bought by
Us Bank Natioanl Association and Lehamn Xs Trust
Current Estimated Value
Purchase Details
Closed on
Aug 9, 2017
Sold by
Wilson Josseph and Wilson Justine C
Bought by
Us Bank Na
Purchase Details
Closed on
Jan 12, 2001
Sold by
Datz Edwin D
Bought by
Wilson Joseph S and Wilson Justine C
Home Financials for this Owner
Home Financials are based on the most recent Mortgage that was taken out on this home.
Original Mortgage
$78,850
Interest Rate
7.13%
Mortgage Type
Purchase Money Mortgage
Create a Home Valuation Report for This Property
The Home Valuation Report is an in-depth analysis detailing your home's value as well as a comparison with similar homes in the area
Home Values in the Area
Average Home Value in this Area
Purchase History
| Date | Buyer | Sale Price | Title Company |
|---|---|---|---|
| Us Bank Natioanl Association | $21,900 | None Available | |
| Us Bank Na | -- | None Available | |
| Wilson Joseph S | $84,694 | -- |
Source: Public Records
Mortgage History
| Date | Status | Borrower | Loan Amount |
|---|---|---|---|
| Previous Owner | Wilson Joseph S | $78,850 |
Source: Public Records
Tax History Compared to Growth
Tax History
| Year | Tax Paid | Tax Assessment Tax Assessment Total Assessment is a certain percentage of the fair market value that is determined by local assessors to be the total taxable value of land and additions on the property. | Land | Improvement |
|---|---|---|---|---|
| 2025 | $3,637 | $75,600 | $40,900 | $34,700 |
| 2024 | $3,508 | $75,600 | $40,900 | $34,700 |
| 2023 | $3,508 | $75,600 | $40,900 | $34,700 |
| 2022 | $3,446 | $75,600 | $40,900 | $34,700 |
| 2021 | $3,400 | $75,600 | $40,900 | $34,700 |
| 2020 | $6,800 | $89,600 | $35,700 | $53,900 |
| 2019 | $6,571 | $137,700 | $35,700 | $102,000 |
| 2018 | $6,425 | $137,700 | $35,700 | $102,000 |
| 2017 | $6,316 | $137,700 | $35,700 | $102,000 |
| 2016 | $6,228 | $137,700 | $35,700 | $102,000 |
| 2015 | $6,126 | $137,700 | $35,700 | $102,000 |
| 2014 | $6,030 | $137,700 | $35,700 | $102,000 |
Source: Public Records
Map
Nearby Homes