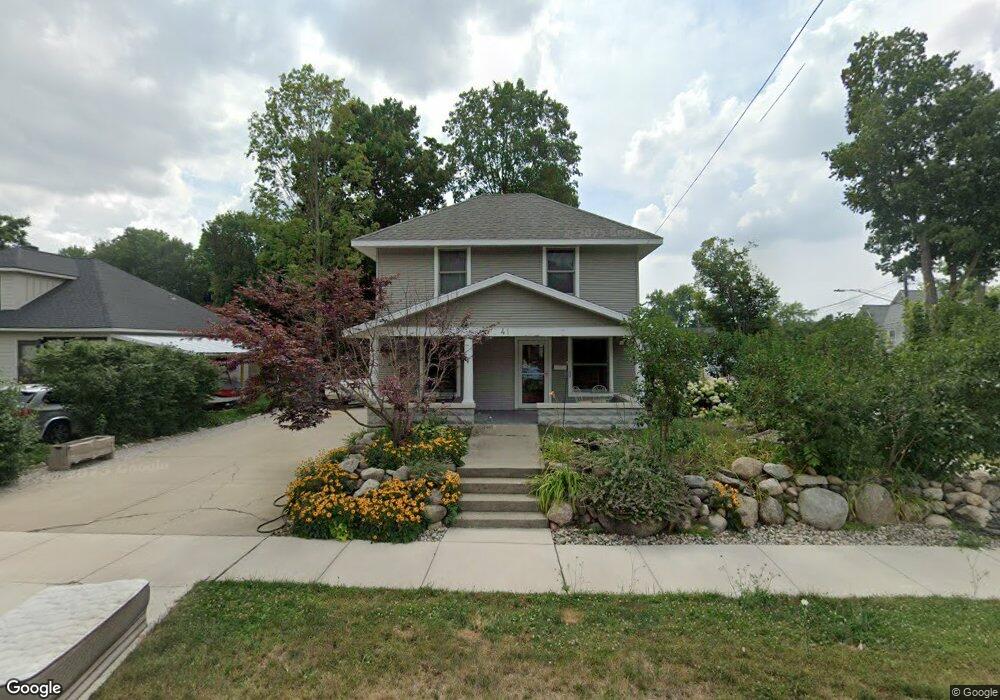
41 S Fremont St NE Rockford, MI 49341
Estimated Value: $182,000 - $352,000
3
Beds
1
Bath
1,380
Sq Ft
$198/Sq Ft
Est. Value
About This Home
This home is located at 41 S Fremont St NE, Rockford, MI 49341 and is currently estimated at $273,086, approximately $197 per square foot. 41 S Fremont St NE is a home located in Kent County with nearby schools including Parkside Elementary School, North Rockford Middle School, and Rockford High School Freshman Center.
Ownership History
Date
Name
Owned For
Owner Type
Purchase Details
Closed on
Sep 17, 2020
Sold by
Harkema Jeffrey T and Harkema Thomas R
Bought by
Karkema Jeffrey T and Karkema Valerie
Current Estimated Value
Home Financials for this Owner
Home Financials are based on the most recent Mortgage that was taken out on this home.
Original Mortgage
$90,000
Outstanding Balance
$64,225
Interest Rate
2.9%
Mortgage Type
New Conventional
Estimated Equity
$208,861
Purchase Details
Closed on
Sep 30, 1999
Sold by
Harkema Jeffrey T
Bought by
Harkema Jeffrey and Harkema Thomas R
Create a Home Valuation Report for This Property
The Home Valuation Report is an in-depth analysis detailing your home's value as well as a comparison with similar homes in the area
Home Values in the Area
Average Home Value in this Area
Purchase History
| Date | Buyer | Sale Price | Title Company |
|---|---|---|---|
| Karkema Jeffrey T | -- | None Available | |
| Harkema Jeffrey | -- | -- |
Source: Public Records
Mortgage History
| Date | Status | Borrower | Loan Amount |
|---|---|---|---|
| Open | Karkema Jeffrey T | $90,000 |
Source: Public Records
Tax History Compared to Growth
Tax History
| Year | Tax Paid | Tax Assessment Tax Assessment Total Assessment is a certain percentage of the fair market value that is determined by local assessors to be the total taxable value of land and additions on the property. | Land | Improvement |
|---|---|---|---|---|
| 2025 | $1,719 | $94,900 | $0 | $0 |
| 2024 | $1,719 | $86,800 | $0 | $0 |
| 2023 | $1,978 | $72,400 | $0 | $0 |
| 2022 | $1,900 | $68,100 | $0 | $0 |
| 2021 | $1,847 | $62,200 | $0 | $0 |
| 2020 | $1,505 | $61,000 | $0 | $0 |
| 2019 | $1,800 | $56,600 | $0 | $0 |
| 2018 | $1,804 | $51,200 | $0 | $0 |
| 2017 | $1,758 | $47,800 | $0 | $0 |
| 2016 | $1,628 | $45,500 | $0 | $0 |
| 2015 | -- | $45,500 | $0 | $0 |
| 2013 | -- | $42,500 | $0 | $0 |
Source: Public Records
Map
Nearby Homes
- 142 E Division St NE
- 131 S Monroe St NE
- 126 S Main St
- 107 S Main St
- 126 N Monroe St
- 175 S Main St
- 179 Tamarack Ln NE
- 153 Gaylord Dr
- 204 Lewis St
- 315 N Main St
- 335 Lewis St
- 116 Kara Ct
- 190 E Main St
- 205 Hunters Ln NE Unit 23
- 273 Summit Ave NE
- 8365 Atlanta Dr NE
- 5090 Natchez Ct NE
- 8343 Atlanta Dr NE
- 4286 Millpond Dr NE
- 4985 Tiamo Ln NE
- 193 Maple St
- 45 S Fremont St NE
- 178 Maple St
- 178 Maple St NE
- 179 Maple St
- 170 Maple St
- 34 S Fremont St NE
- 206 Maple St
- 57 S Fremont St NE
- 17 S Fremont St NE
- 52 S Fremont St NE
- 20 S Fremont St NE
- 164 Maple St
- 219 Maple St
- 61 S Fremont St NE
- 60 S Fremont St NE
- 219 Maple St NE
- 12 S Fremont St NE
- 220 Maple St
- 226 Maple St