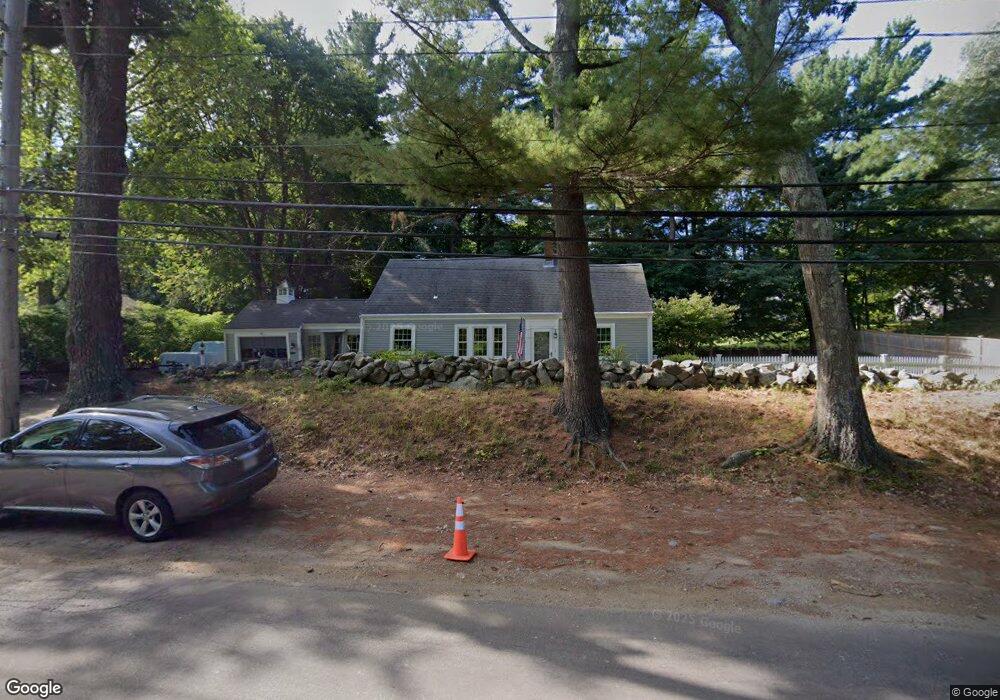
41 S Pleasant St Hingham, MA 02043
South Hingham NeighborhoodEstimated Value: $1,066,245 - $1,320,000
3
Beds
2
Baths
1,493
Sq Ft
$788/Sq Ft
Est. Value
About This Home
This home is located at 41 S Pleasant St, Hingham, MA 02043 and is currently estimated at $1,176,811, approximately $788 per square foot. 41 S Pleasant St is a home with nearby schools including South Elementary School, St. Paul Elementary School, and Lindamood - Bell Academy.
Ownership History
Date
Name
Owned For
Owner Type
Purchase Details
Closed on
Jul 14, 1995
Sold by
Fleming Beverly F
Bought by
Roper Joseph C and Roper Holly A
Current Estimated Value
Home Financials for this Owner
Home Financials are based on the most recent Mortgage that was taken out on this home.
Original Mortgage
$115,000
Interest Rate
7.7%
Mortgage Type
Purchase Money Mortgage
Create a Home Valuation Report for This Property
The Home Valuation Report is an in-depth analysis detailing your home's value as well as a comparison with similar homes in the area
Home Values in the Area
Average Home Value in this Area
Purchase History
| Date | Buyer | Sale Price | Title Company |
|---|---|---|---|
| Roper Joseph C | $245,000 | -- |
Source: Public Records
Mortgage History
| Date | Status | Borrower | Loan Amount |
|---|---|---|---|
| Open | Roper Joseph C | $383,000 | |
| Closed | Roper Joseph C | $100,000 | |
| Closed | Roper Joseph C | $120,000 | |
| Closed | Roper Joseph C | $115,000 |
Source: Public Records
Tax History Compared to Growth
Tax History
| Year | Tax Paid | Tax Assessment Tax Assessment Total Assessment is a certain percentage of the fair market value that is determined by local assessors to be the total taxable value of land and additions on the property. | Land | Improvement |
|---|---|---|---|---|
| 2025 | $10,431 | $975,800 | $566,500 | $409,300 |
| 2024 | $10,099 | $930,800 | $566,500 | $364,300 |
| 2023 | $8,820 | $882,000 | $566,500 | $315,500 |
| 2022 | $8,462 | $732,000 | $472,100 | $259,900 |
| 2021 | $8,454 | $716,400 | $491,700 | $224,700 |
| 2020 | $8,260 | $716,400 | $491,700 | $224,700 |
| 2019 | $8,230 | $696,900 | $491,700 | $205,200 |
| 2018 | $8,155 | $692,900 | $491,700 | $201,200 |
| 2017 | $7,916 | $646,200 | $485,000 | $161,200 |
| 2016 | $7,784 | $623,200 | $462,000 | $161,200 |
| 2015 | $7,534 | $601,300 | $440,100 | $161,200 |
Source: Public Records
Map
Nearby Homes
- 43 S Pleasant St
- 45 S Pleasant St
- 33 S Pleasant St
- 46 S Pleasant St
- 4 Fulling Mill Ln
- 6 Fulling Mill Ln
- 29 S Pleasant St
- 51 S Pleasant St
- 8 Fulling Mill Ln
- 5B Fulling Mill Ln
- Eight Fulling Mill Ln
- 3 Fulling Mill Ln
- 10 Fulling Mill Ln
- 1 Fulling Mill Ln
- 16 S Pleasant St
- 12 Fulling Mill Ln
- 5 Fulling Mill Ln
- 5 Fulling Mill Ln
- 5C Fulling Mill Ln
- 11 S Pleasant St