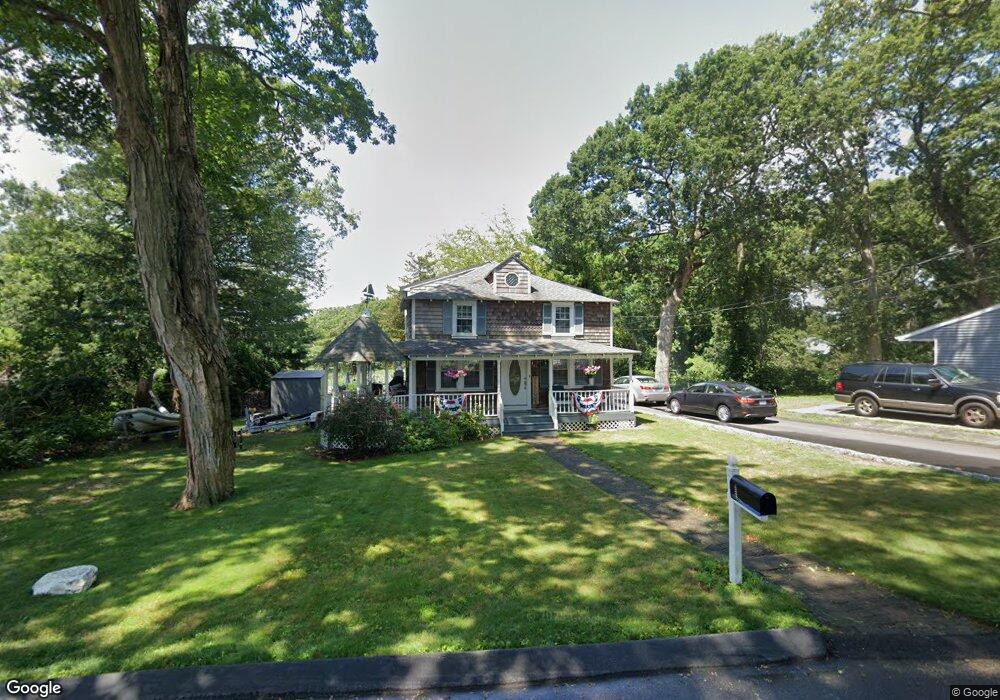
41 Sea View Dr Warwick, RI 02889
Oakland Beach NeighborhoodEstimated Value: $355,000 - $480,000
3
Beds
2
Baths
1,200
Sq Ft
$350/Sq Ft
Est. Value
About This Home
This home is located at 41 Sea View Dr, Warwick, RI 02889 and is currently estimated at $419,832, approximately $349 per square foot. 41 Sea View Dr is a home located in Kent County with nearby schools including Saint Kevin School, St Rose Of Lima School, and Bishop Hendricken High School.
Ownership History
Date
Name
Owned For
Owner Type
Purchase Details
Closed on
Aug 16, 2018
Sold by
Kristine M Loven Ret and Loven
Bought by
Unknown
Current Estimated Value
Purchase Details
Closed on
Jan 6, 2015
Sold by
Rochon Nancy T
Bought by
Nancy Taylor Rochon Re and Rochon
Purchase Details
Closed on
Jun 8, 1995
Sold by
Kenney James P
Bought by
Taylor Nancy R
Home Financials for this Owner
Home Financials are based on the most recent Mortgage that was taken out on this home.
Original Mortgage
$69,600
Interest Rate
8.21%
Mortgage Type
Purchase Money Mortgage
Purchase Details
Closed on
Oct 19, 1989
Sold by
Leamy Dolores
Bought by
Kenney James P
Create a Home Valuation Report for This Property
The Home Valuation Report is an in-depth analysis detailing your home's value as well as a comparison with similar homes in the area
Home Values in the Area
Average Home Value in this Area
Purchase History
| Date | Buyer | Sale Price | Title Company |
|---|---|---|---|
| Unknown | -- | -- | |
| Nancy Taylor Rochon Re | -- | -- | |
| Taylor Nancy R | $87,000 | -- | |
| Kenney James P | $95,000 | -- | |
| Kenney James P | $95,000 | -- |
Source: Public Records
Mortgage History
| Date | Status | Borrower | Loan Amount |
|---|---|---|---|
| Previous Owner | Kenney James P | $101,738 | |
| Previous Owner | Kenney James P | $96,800 | |
| Previous Owner | Kenney James P | $69,600 |
Source: Public Records
Tax History
| Year | Tax Paid | Tax Assessment Tax Assessment Total Assessment is a certain percentage of the fair market value that is determined by local assessors to be the total taxable value of land and additions on the property. | Land | Improvement |
|---|---|---|---|---|
| 2025 | $5,805 | $457,100 | $236,700 | $220,400 |
| 2024 | $5,570 | $384,900 | $205,900 | $179,000 |
| 2023 | $5,462 | $384,900 | $205,900 | $179,000 |
| 2022 | $4,862 | $259,600 | $122,200 | $137,400 |
| 2021 | $4,862 | $259,600 | $122,200 | $137,400 |
| 2020 | $4,862 | $259,600 | $122,200 | $137,400 |
| 2019 | $4,862 | $259,600 | $122,200 | $137,400 |
| 2018 | $4,505 | $216,600 | $122,200 | $94,400 |
| 2017 | $4,384 | $216,600 | $122,200 | $94,400 |
| 2016 | $4,384 | $216,600 | $122,200 | $94,400 |
| 2015 | $4,135 | $199,300 | $73,100 | $126,200 |
| 2014 | $3,998 | $199,300 | $73,100 | $126,200 |
| 2013 | $3,944 | $199,300 | $73,100 | $126,200 |
Source: Public Records
Map
Nearby Homes
- 53 Sea View Dr
- 42 Sea View Dr
- 19 Sea View Dr
- 32 Sea View Dr
- 32 Sea View Dr Unit 1
- 50 Sea View Dr
- 60 Sea View Dr
- 24 Sea View Dr
- 27 Elliot Ave
- 93 Langley St
- 671 Elliot Ave
- 190 Gordon Ave
- 11 Sea View Dr
- 478 Oakhurst Ave
- 90 Langley St
- 194 Gordon Ave
- 84 Sea View Dr
- 68 Sea View Dr
- 72 Sea View Dr
- 204 Gordon Ave
Your Personal Tour Guide
Ask me questions while you tour the home.