Estimated Value: $146,579 - $244,000
--
Bed
--
Bath
1,281
Sq Ft
$159/Sq Ft
Est. Value
About This Home
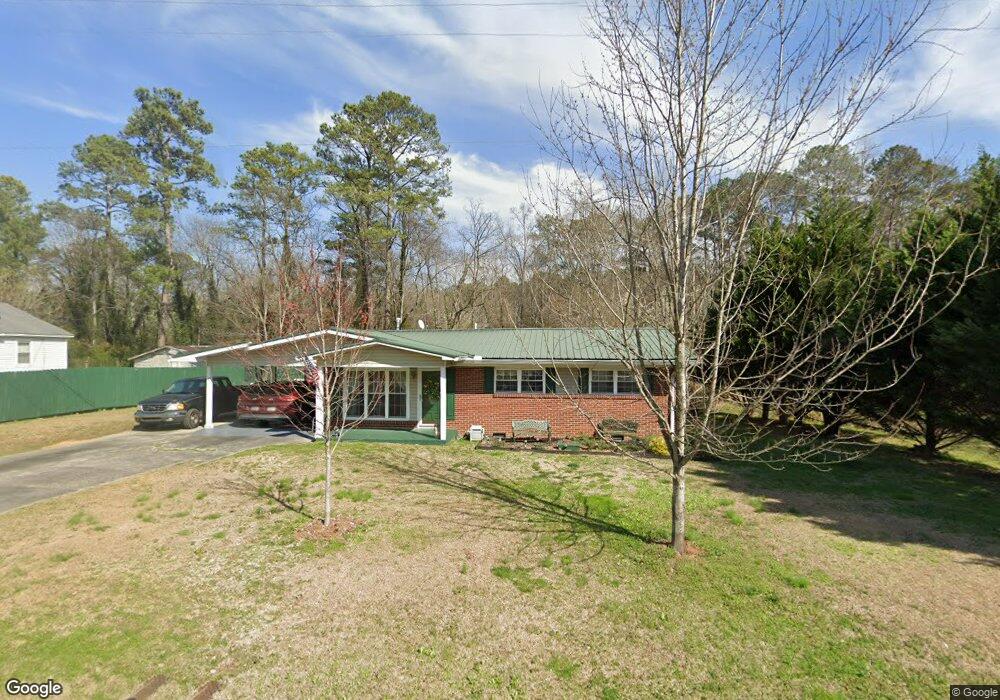
This home is located at 41 Smith Rd SW, Rome, GA 30165 and is currently estimated at $203,395, approximately $158 per square foot. 41 Smith Rd SW is a home located in Floyd County with nearby schools including Rome High School.
Ownership History
Date
Name
Owned For
Owner Type
Purchase Details
Closed on
Jan 10, 2023
Sold by
Knisley Kellie D
Bought by
Studdard Clyde William and Studdard Patricia Ann
Current Estimated Value
Purchase Details
Closed on
Jan 19, 2010
Sold by
Studdard Patricia Ann
Bought by
Studdard Patricia Ann and Studdard Clyde Willi
Purchase Details
Closed on
Mar 19, 1998
Sold by
Studdard Patricia Ann F and Studdard K
Bought by
Studdard Patricia Ann
Purchase Details
Closed on
Apr 30, 1994
Sold by
Helms Patricia A
Bought by
Studdard Patricia Ann F and Studdard K
Purchase Details
Closed on
Feb 2, 1990
Sold by
Smith Betty
Bought by
Helms Patricia A
Purchase Details
Closed on
Feb 24, 1989
Sold by
P\R
Bought by
Smith Betty
Purchase Details
Closed on
Nov 23, 1983
Sold by
Smith Raymond E and Smith Betty
Bought by
P\R
Purchase Details
Closed on
Oct 27, 1967
Sold by
Jones Wm E and Jones Teena
Bought by
Smith Raymond E and Smith Betty
Purchase Details
Closed on
Oct 27, 1965
Sold by
Shavers Andrew B
Bought by
Jones Wm E and Jones Teena
Purchase Details
Closed on
Jan 1, 1901
Bought by
Shavers Andrew B
Create a Home Valuation Report for This Property
The Home Valuation Report is an in-depth analysis detailing your home's value as well as a comparison with similar homes in the area
Home Values in the Area
Average Home Value in this Area
Purchase History
| Date | Buyer | Sale Price | Title Company |
|---|---|---|---|
| Studdard Clyde William | -- | -- | |
| Studdard Patricia Ann | -- | -- | |
| Studdard Patricia Ann | -- | -- | |
| Studdard Patricia Ann F | -- | -- | |
| Helms Patricia A | $37,300 | -- | |
| Smith Betty | -- | -- | |
| P\R | -- | -- | |
| Smith Raymond E | $16,100 | -- | |
| Jones Wm E | $13,200 | -- | |
| Shavers Andrew B | -- | -- |
Source: Public Records
Tax History Compared to Growth
Tax History
| Year | Tax Paid | Tax Assessment Tax Assessment Total Assessment is a certain percentage of the fair market value that is determined by local assessors to be the total taxable value of land and additions on the property. | Land | Improvement |
|---|---|---|---|---|
| 2024 | $579 | $58,662 | $5,600 | $53,062 |
| 2023 | $574 | $55,725 | $4,800 | $50,925 |
| 2022 | $284 | $41,239 | $4,000 | $37,239 |
| 2021 | $275 | $37,158 | $4,000 | $33,158 |
| 2020 | $280 | $34,566 | $3,200 | $31,366 |
| 2019 | $272 | $32,775 | $3,200 | $29,575 |
| 2018 | $272 | $30,984 | $3,200 | $27,784 |
| 2017 | $273 | $29,944 | $3,200 | $26,744 |
| 2016 | $277 | $29,212 | $3,200 | $26,012 |
| 2015 | $243 | $29,216 | $3,200 | $26,016 |
| 2014 | $243 | $25,912 | $3,200 | $22,712 |
Source: Public Records
Map
Nearby Homes
- 14 Limon Place SW
- 37 Mountain Chase Rd SW
- 2 Stonebrook Dr SW
- 52 Glenda Dr SW
- 37 Willowrun Dr SW
- 329 Leafmore Rd SW
- 99 Janie Beth Dr SW
- 11 Willowrun Dr SW
- 10 Willowrun Dr
- 27 Stonebrook Dr SW
- 23 Berryrun Dr SW
- 1 Willowrun Dr SW
- 12 Lucas Ln SW
- The Foxcroft Plan at North Haven
- The McGinnis Plan at North Haven
- The Caldwell Plan at North Haven
- The Bradley Plan at North Haven
- The Pearson Plan at North Haven
- The Coleman Plan at North Haven
- The Grayson Plan at North Haven
- 29 Smith Rd SW
- 57 Smith Rd SW
- 21 Smith Rd SW
- 42 Smith Rd SW
- 705 Burnett Ferry Rd SW
- 60 Smith Rd SW
- 0 Halstead Smith Rd Unit 2694477
- 0 Halstead Smith Rd Unit 7417423
- 0 Halstead Smith Rd Unit 8044346
- 0 Halstead Rd Unit 3934284
- 0 Halstead Smith Rd Unit 5354735
- 0 Halstead Smith Rd Unit 5727260
- 10 Smith Rd SW
- 18 Timberlane Terrace SW
- 18 Timberlane Terrace SW
- 68 Smith Rd SW
- 711 Burnett Ferry Rd SW
- 77 Smith Rd SW
- 627 Burnett Ferry Rd SW
- 20 Timberlane Terrace SW