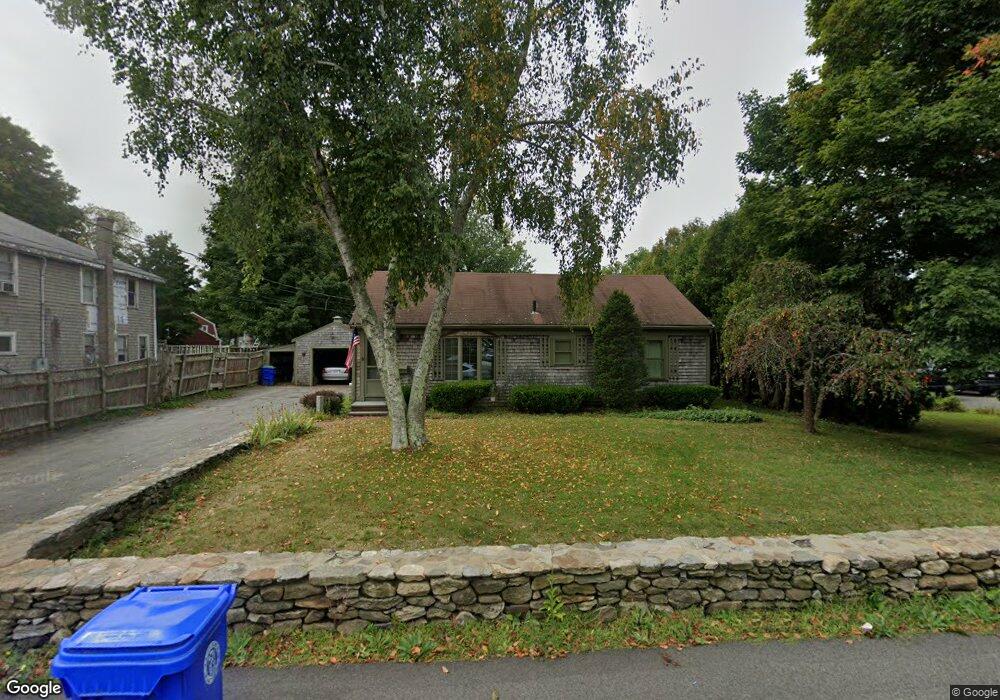
41 Spring St Rockland, MA 02370
Estimated Value: $593,865 - $732,000
4
Beds
1
Bath
3,240
Sq Ft
$202/Sq Ft
Est. Value
About This Home
This home is located at 41 Spring St, Rockland, MA 02370 and is currently estimated at $653,216, approximately $201 per square foot. 41 Spring St is a home located in Plymouth County with nearby schools including Rockland Senior High School, Calvary Chapel Academy, and St Bridget School.
Ownership History
Date
Name
Owned For
Owner Type
Purchase Details
Closed on
Apr 14, 2011
Sold by
Merritt Robert W
Bought by
Robert W Merritt T
Current Estimated Value
Purchase Details
Closed on
Dec 12, 1986
Bought by
Robert W Merritt T
Create a Home Valuation Report for This Property
The Home Valuation Report is an in-depth analysis detailing your home's value as well as a comparison with similar homes in the area
Home Values in the Area
Average Home Value in this Area
Purchase History
| Date | Buyer | Sale Price | Title Company |
|---|---|---|---|
| Robert W Merritt T | -- | -- | |
| Robert W Merritt T | -- | -- |
Source: Public Records
Mortgage History
| Date | Status | Borrower | Loan Amount |
|---|---|---|---|
| Previous Owner | Robert W Merritt T | $480,000 | |
| Previous Owner | Robert W Merritt T | $45,000 | |
| Previous Owner | Robert W Merritt T | $37,000 | |
| Previous Owner | Robert W Merritt T | $50,000 |
Source: Public Records
Tax History Compared to Growth
Tax History
| Year | Tax Paid | Tax Assessment Tax Assessment Total Assessment is a certain percentage of the fair market value that is determined by local assessors to be the total taxable value of land and additions on the property. | Land | Improvement |
|---|---|---|---|---|
| 2025 | $7,514 | $549,700 | $231,100 | $318,600 |
| 2024 | $7,352 | $522,900 | $218,000 | $304,900 |
| 2023 | $7,478 | $491,300 | $210,400 | $280,900 |
| 2022 | $7,229 | $431,600 | $183,000 | $248,600 |
| 2021 | $6,300 | $395,300 | $166,300 | $229,000 |
| 2020 | $6,608 | $377,600 | $158,400 | $219,200 |
| 2019 | $6,512 | $363,400 | $150,900 | $212,500 |
| 2018 | $6,211 | $340,900 | $150,900 | $190,000 |
| 2017 | $5,739 | $325,900 | $150,900 | $175,000 |
| 2016 | $5,917 | $320,000 | $145,100 | $174,900 |
| 2015 | $5,679 | $298,400 | $135,600 | $162,800 |
| 2014 | $5,379 | $293,300 | $133,000 | $160,300 |
Source: Public Records
Map
Nearby Homes
- 101 Central St
- 225 W Water St
- 158 Central St
- 9 Pat Rose Way
- 6 Pat Rose Way
- 8 Pat Rose Way
- 103 Grove St Unit 337
- 103 Grove St Unit 349
- 135 Grove St Unit 115
- 135 Grove St Unit 110
- 135 Grove St Unit 133
- 17 Pat Rose Way
- 119 Grove St Unit 238
- 119 Grove St Unit 223
- 12 Linden St
- 50 Linden Park
- 7 Carlys Way
- 810 Brookline Way
- 49 Liberty St
- 46 Carey St