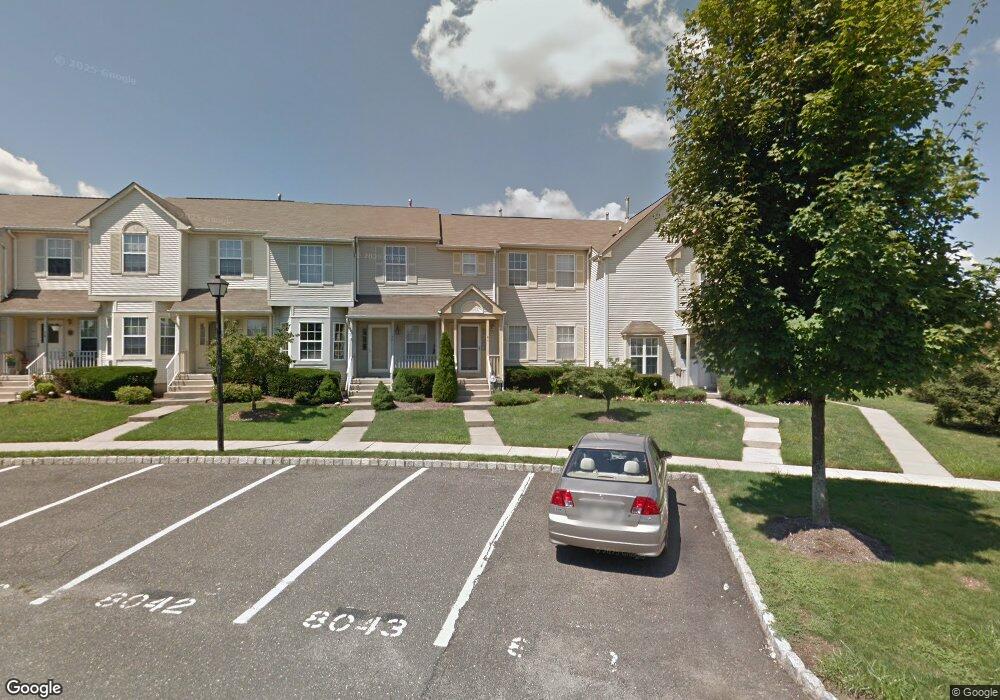
41 Tasley Ct Trenton, NJ 08691
Estimated Value: $496,833 - $543,000
--
Bed
--
Bath
1,460
Sq Ft
$357/Sq Ft
Est. Value
About This Home
This home is located at 41 Tasley Ct, Trenton, NJ 08691 and is currently estimated at $521,708, approximately $357 per square foot. 41 Tasley Ct is a home located in Mercer County with nearby schools including Sharon Elementary School, Pond Road Middle School, and Robbinsville High School.
Ownership History
Date
Name
Owned For
Owner Type
Purchase Details
Closed on
Sep 7, 2016
Sold by
Edington Michele L
Bought by
Coughlin Craig and Ricci Tara
Current Estimated Value
Purchase Details
Closed on
May 16, 2003
Sold by
Staudt Deborah
Bought by
Edington Michele
Home Financials for this Owner
Home Financials are based on the most recent Mortgage that was taken out on this home.
Original Mortgage
$147,350
Interest Rate
5.71%
Mortgage Type
Purchase Money Mortgage
Purchase Details
Closed on
Dec 13, 2000
Sold by
Pintimalli Frank
Bought by
Stuadt Deborah
Purchase Details
Closed on
Jun 4, 1999
Sold by
Bergh Eric
Bought by
Pintimalli Frank and Pintimalli Rita
Purchase Details
Closed on
Nov 13, 1995
Sold by
Sharbell Washington Inc
Bought by
Bergh Eric H
Home Financials for this Owner
Home Financials are based on the most recent Mortgage that was taken out on this home.
Original Mortgage
$102,000
Interest Rate
7.53%
Mortgage Type
FHA
Create a Home Valuation Report for This Property
The Home Valuation Report is an in-depth analysis detailing your home's value as well as a comparison with similar homes in the area
Home Values in the Area
Average Home Value in this Area
Purchase History
| Date | Buyer | Sale Price | Title Company |
|---|---|---|---|
| Coughlin Craig | $235,000 | Monarch Title Agency Inc | |
| Edington Michele | $210,500 | -- | |
| Stuadt Deborah | $151,500 | -- | |
| Pintimalli Frank | $122,000 | -- | |
| Bergh Eric H | $115,192 | -- |
Source: Public Records
Mortgage History
| Date | Status | Borrower | Loan Amount |
|---|---|---|---|
| Previous Owner | Edington Michele | $147,350 | |
| Previous Owner | Bergh Eric H | $102,000 |
Source: Public Records
Tax History Compared to Growth
Tax History
| Year | Tax Paid | Tax Assessment Tax Assessment Total Assessment is a certain percentage of the fair market value that is determined by local assessors to be the total taxable value of land and additions on the property. | Land | Improvement |
|---|---|---|---|---|
| 2025 | $8,626 | $258,100 | $133,200 | $124,900 |
| 2024 | $8,050 | $258,100 | $133,200 | $124,900 |
| 2023 | $8,050 | $258,100 | $133,200 | $124,900 |
| 2022 | $7,738 | $258,100 | $133,200 | $124,900 |
| 2021 | $7,627 | $258,100 | $133,200 | $124,900 |
| 2020 | $7,629 | $258,100 | $133,200 | $124,900 |
| 2019 | $7,632 | $258,100 | $133,200 | $124,900 |
| 2018 | $7,583 | $258,100 | $133,200 | $124,900 |
| 2017 | $7,567 | $258,100 | $133,200 | $124,900 |
| 2016 | $7,498 | $258,100 | $133,200 | $124,900 |
| 2015 | $7,384 | $258,100 | $133,200 | $124,900 |
| 2014 | $7,410 | $258,100 | $133,200 | $124,900 |
Source: Public Records
Map
Nearby Homes