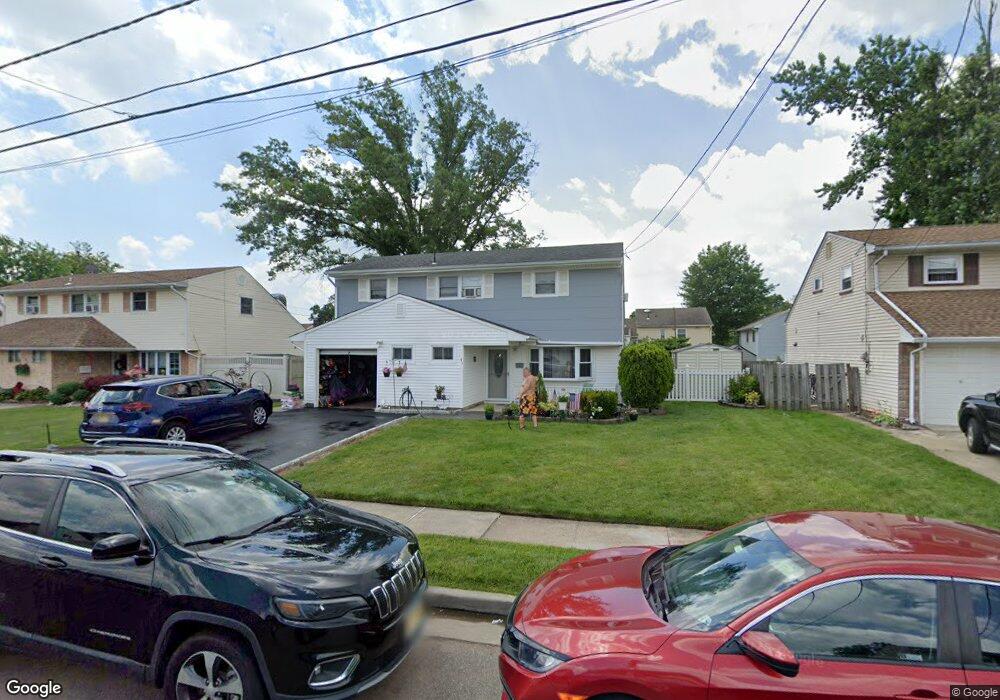
41 Tennyson St Carteret, NJ 07008
Estimated Value: $460,981 - $585,000
--
Bed
--
Bath
1,344
Sq Ft
$408/Sq Ft
Est. Value
About This Home
This home is located at 41 Tennyson St, Carteret, NJ 07008 and is currently estimated at $548,495, approximately $408 per square foot. 41 Tennyson St is a home located in Middlesex County with nearby schools including Carteret High School and St Joseph School.
Ownership History
Date
Name
Owned For
Owner Type
Purchase Details
Closed on
Apr 28, 2017
Sold by
Nadlny David J and Reilly Gail A
Bought by
Pysniak Michael and Pysniak Michele Mp
Current Estimated Value
Home Financials for this Owner
Home Financials are based on the most recent Mortgage that was taken out on this home.
Original Mortgage
$217,979
Outstanding Balance
$179,509
Interest Rate
3.75%
Mortgage Type
FHA
Estimated Equity
$368,986
Create a Home Valuation Report for This Property
The Home Valuation Report is an in-depth analysis detailing your home's value as well as a comparison with similar homes in the area
Home Values in the Area
Average Home Value in this Area
Purchase History
| Date | Buyer | Sale Price | Title Company |
|---|---|---|---|
| Pysniak Michael | $222,000 | Presidential Title Agency |
Source: Public Records
Mortgage History
| Date | Status | Borrower | Loan Amount |
|---|---|---|---|
| Open | Pysniak Michael | $217,979 |
Source: Public Records
Tax History Compared to Growth
Tax History
| Year | Tax Paid | Tax Assessment Tax Assessment Total Assessment is a certain percentage of the fair market value that is determined by local assessors to be the total taxable value of land and additions on the property. | Land | Improvement |
|---|---|---|---|---|
| 2025 | $6,985 | $472,500 | $339,900 | $132,600 |
| 2024 | $6,805 | $219,100 | $123,800 | $95,300 |
| 2023 | $6,805 | $219,100 | $123,800 | $95,300 |
| 2022 | $6,617 | $219,100 | $123,800 | $95,300 |
| 2021 | $3,174 | $219,100 | $123,800 | $95,300 |
| 2020 | $6,301 | $219,100 | $123,800 | $95,300 |
| 2019 | $6,119 | $219,100 | $123,800 | $95,300 |
| 2018 | $5,975 | $219,100 | $123,800 | $95,300 |
| 2017 | $5,762 | $219,100 | $123,800 | $95,300 |
| 2016 | $5,970 | $188,500 | $93,800 | $94,700 |
| 2015 | $5,883 | $188,500 | $93,800 | $94,700 |
| 2014 | $5,627 | $188,500 | $93,800 | $94,700 |
Source: Public Records
Map
Nearby Homes