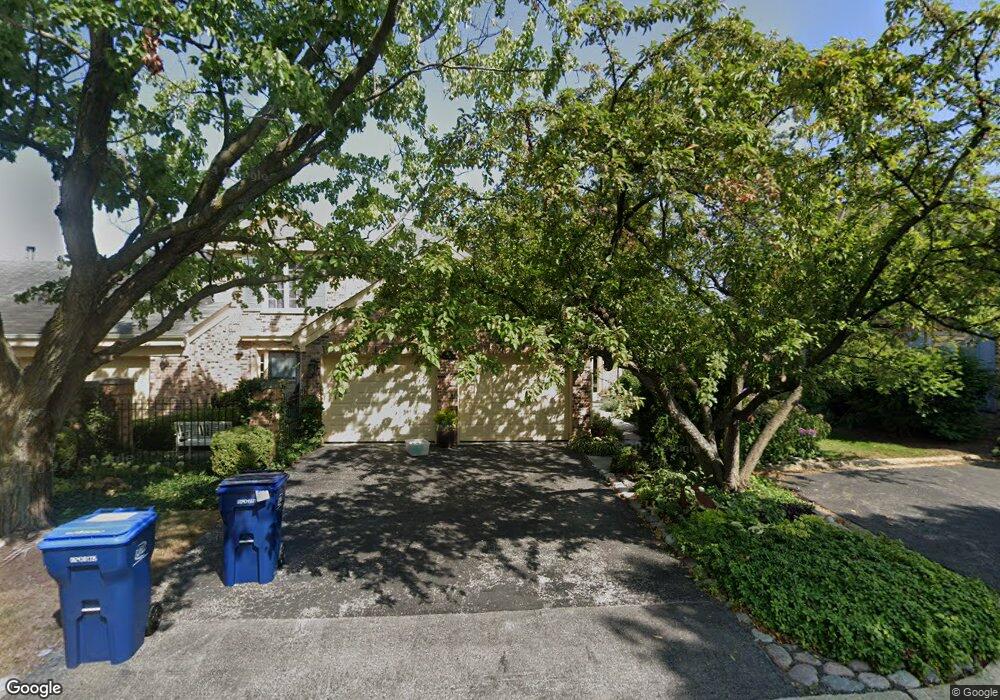
41 The Court of Cobblestone Unit 1A Northbrook, IL 60062
Estimated Value: $587,502 - $678,000
3
Beds
3
Baths
2,040
Sq Ft
$318/Sq Ft
Est. Value
About This Home
This home is located at 41 The Court of Cobblestone Unit 1A, Northbrook, IL 60062 and is currently estimated at $649,126, approximately $318 per square foot. 41 The Court of Cobblestone Unit 1A is a home located in Cook County with nearby schools including Hickory Point Elementary School, Shabonee Elementary School, and Wood Oaks Jr High School.
Ownership History
Date
Name
Owned For
Owner Type
Purchase Details
Closed on
Oct 5, 2023
Sold by
Kisting Madeline
Bought by
Madeline Mccarron Kisting Revocable Trust and Kisting
Current Estimated Value
Purchase Details
Closed on
Nov 29, 2005
Sold by
Declaration Maltenfort Babs W
Bought by
Kisting Madeline
Home Financials for this Owner
Home Financials are based on the most recent Mortgage that was taken out on this home.
Original Mortgage
$301,000
Interest Rate
6.36%
Mortgage Type
Fannie Mae Freddie Mac
Purchase Details
Closed on
Aug 8, 2005
Sold by
Stanton Diane T
Bought by
Declaration Maltenfort Babs W and Babs W Maltenfort Declaration Of Trust
Purchase Details
Closed on
Oct 1, 2002
Sold by
Cole Taylor Bank
Bought by
Stanton Diane T and Stanton Roger E
Create a Home Valuation Report for This Property
The Home Valuation Report is an in-depth analysis detailing your home's value as well as a comparison with similar homes in the area
Home Values in the Area
Average Home Value in this Area
Purchase History
| Date | Buyer | Sale Price | Title Company |
|---|---|---|---|
| Madeline Mccarron Kisting Revocable Trust | -- | None Listed On Document | |
| Kisting Madeline | $534,000 | Rtc | |
| Declaration Maltenfort Babs W | $529,000 | Cst | |
| Stanton Diane T | -- | -- |
Source: Public Records
Mortgage History
| Date | Status | Borrower | Loan Amount |
|---|---|---|---|
| Previous Owner | Kisting Madeline | $301,000 |
Source: Public Records
Tax History Compared to Growth
Tax History
| Year | Tax Paid | Tax Assessment Tax Assessment Total Assessment is a certain percentage of the fair market value that is determined by local assessors to be the total taxable value of land and additions on the property. | Land | Improvement |
|---|---|---|---|---|
| 2024 | $9,314 | $45,901 | $8,999 | $36,902 |
| 2023 | $8,954 | $45,901 | $8,999 | $36,902 |
| 2022 | $8,954 | $45,901 | $8,999 | $36,902 |
| 2021 | $6,824 | $32,951 | $7,103 | $25,848 |
| 2020 | $6,825 | $32,951 | $7,103 | $25,848 |
| 2019 | $6,656 | $36,210 | $7,103 | $29,107 |
| 2018 | $10,022 | $47,766 | $6,150 | $41,616 |
| 2017 | $9,766 | $47,766 | $6,150 | $41,616 |
| 2016 | $9,553 | $47,766 | $6,150 | $41,616 |
| 2015 | $8,574 | $37,750 | $5,110 | $32,640 |
| 2014 | $8,380 | $37,750 | $5,110 | $32,640 |
| 2013 | $8,129 | $37,750 | $5,110 | $32,640 |
Source: Public Records
Map
Nearby Homes
- 8 The Court of Charlwood
- 9 the Court of Lagoon View
- 3 The Court of Harborside Unit 111
- 1331 Adirondack Dr Unit 1
- 47 The Court of Greenway Unit 121
- 1400 Kingsport Ct
- 1415 Chartres Dr Unit 1F
- 1421 Chartres Dr
- 1696 Highland Ave
- 1671 Mission Hills Rd Unit S
- 1671 Mission Hills Rd Unit 501
- 3110 Pheasant Creek Dr Unit 101
- 3110 Pheasant Creek Dr Unit 206
- 3110 Pheasant Creek Dr Unit A
- 1620 Provenance Way
- 1039 Sussex Dr Unit 1039
- 1012 Sussex Dr Unit 1012
- 2810 Weller Ln
- 3070 Pheasant Creek Dr Unit 201
- 1331 Pfingsten Rd
- 40 The Court of Cobblestone
- 39 The Court of Cobblestone
- 42 The Court of Cobblestone Unit 1A
- 43 The Court of Cobblestone
- 43 Ct of Cobblestone
- 38 The Court of Cobblestone
- 6 The Court of Cobblestone
- 5 The Court of Cobblestone
- 44 The Court of Cobblestone
- 37 The Court of Cobblestone
- 4 The Court of Cobblestone Unit 1A
- 4 Ct of Cobblestone Ct
- 7 The Court of Island Point
- 6 The Court of Island Point
- 6 The Court of Island Point
- 7 The Court of Island Point
- 3 The Court of Cobblestone
- 45 The Court of Cobblestone
- 8 The Court of Island Point
- 5 The Court of Island Point