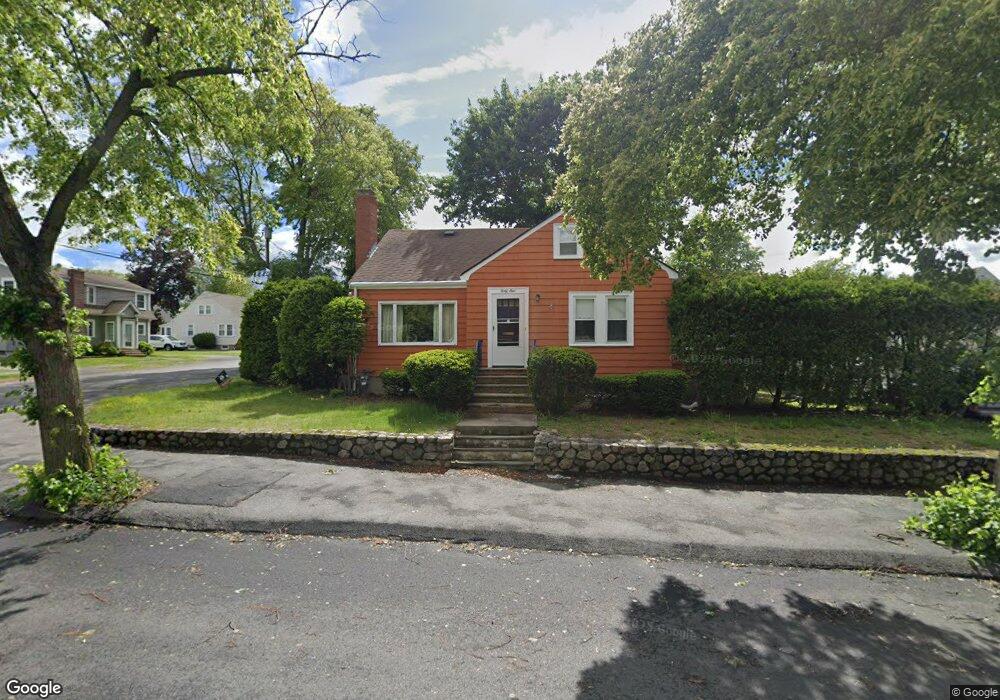
41 Thorpe Rd Lynn, MA 01905
Lower Boston Street NeighborhoodEstimated Value: $590,000 - $731,000
4
Beds
2
Baths
1,804
Sq Ft
$371/Sq Ft
Est. Value
About This Home
This home is located at 41 Thorpe Rd, Lynn, MA 01905 and is currently estimated at $670,031, approximately $371 per square foot. 41 Thorpe Rd is a home located in Essex County with nearby schools including North Park Elementary School, Lincoln-Thomson Elementary School, and William R. Fallon School.
Ownership History
Date
Name
Owned For
Owner Type
Purchase Details
Closed on
Nov 8, 2001
Sold by
A&M Rt and Brinadmour Andrew
Bought by
King Wayne J and King Sandra M
Current Estimated Value
Home Financials for this Owner
Home Financials are based on the most recent Mortgage that was taken out on this home.
Original Mortgage
$223,000
Interest Rate
6.77%
Mortgage Type
Purchase Money Mortgage
Create a Home Valuation Report for This Property
The Home Valuation Report is an in-depth analysis detailing your home's value as well as a comparison with similar homes in the area
Home Values in the Area
Average Home Value in this Area
Purchase History
| Date | Buyer | Sale Price | Title Company |
|---|---|---|---|
| King Wayne J | $248,000 | -- | |
| King Wayne J | $248,000 | -- |
Source: Public Records
Mortgage History
| Date | Status | Borrower | Loan Amount |
|---|---|---|---|
| Open | King Wayne J | $192,768 | |
| Closed | King Wayne J | $223,000 |
Source: Public Records
Tax History Compared to Growth
Tax History
| Year | Tax Paid | Tax Assessment Tax Assessment Total Assessment is a certain percentage of the fair market value that is determined by local assessors to be the total taxable value of land and additions on the property. | Land | Improvement |
|---|---|---|---|---|
| 2025 | $6,680 | $644,800 | $226,300 | $418,500 |
| 2024 | $6,148 | $583,900 | $198,800 | $385,100 |
| 2023 | $6,059 | $543,400 | $205,400 | $338,000 |
| 2022 | $5,772 | $464,400 | $152,000 | $312,400 |
| 2021 | $5,320 | $408,300 | $139,800 | $268,500 |
| 2020 | $5,191 | $387,400 | $134,600 | $252,800 |
| 2019 | $5,248 | $367,000 | $126,700 | $240,300 |
| 2018 | $5,236 | $345,600 | $139,800 | $205,800 |
| 2017 | $4,803 | $307,900 | $116,200 | $191,700 |
| 2016 | $4,678 | $289,100 | $108,800 | $180,300 |
| 2015 | $4,472 | $267,000 | $107,900 | $159,100 |
Source: Public Records
Map
Nearby Homes
- 35 Curran Rd
- 110 Holyoke St
- 100 Ashland St
- 20 Houston St
- 92-94 Newton Ave
- 725 Boston St
- 28 Wyman St
- 79 Laurel St
- 32 Birch Brook Rd Unit 27
- 32 Birch Brook Rd Unit 16
- 32 Birch Brook Rd Unit 1
- 32 Birch Brook Rd Unit 25
- 32 Birch Brook Rd Unit 22
- 32 Birch Brook Rd Unit 28
- 268 Walnut St
- 86 Laurel St
- 29 Fenton Ave
- 771 Boston St
- 505-507 Boston St
- 16 Linden St